Flowable Inspect User Guide
This user guide explains the concepts and features of Flowable Inspect.
What is Flowable Inspect?
Flowable Inspect is a process and case debugging and test component that can be used with various Flowable products, targeted at modeler, developer and test environments. Flowable Inspect is not intended to be used in production runtime environments because it will make all the case and process accessible for all authenticated users, consequently, using it this way is unsupported. By default, Flowable Inspect is not enabled and it needs to be explicitly enabled with a configuration property flowable.inspect.enabled=true.
Flowable Inspect allows users to debug case, process and task instances by providing additional information about activities, timer jobs, variables and so on. In addition, actions can be included to trigger timer jobs, send signal or message events or change variable values. It's also possible to test expression values in the current scope of a running case or process instance.
Besides providing debugging functionality, Flowable Inspect also allows a user to create test definitions while stepping through case and process instances. The actions that a user performs in the Flowable Work UI, such as completing a user task with a form, or running a manual activation action, are automatically recorded. A user can also add validations on variable values to verify the correct running of the instance. All actions are aggregated in a test model, which is listed in the list of recorded tests in Flowable Inspect.
To make it easier to work on a test model it's possible to set breakpoints on activities in a CMMN and BPMN model. This allows users to break on activities like service tasks or gateways that would otherwise be executed automatically, and then variable values and expressions can be evaluated. For testing case and process models that have external logic in HTTP tasks or other service task types, it's also possible to skip a service task and mock the response by defining the output variables on a service task. In the following sections we will have a closer look at the features that Flowable Inspect offers.
Enabling Flowable Inspect
Flowable Inspect is a separate component in the Flowable product portfolio and Flowable explicitly checks for the Flowable Inspect component to be permitted in the license. If you have an existing Flowable license that was provided before the 3.7.0 release, then you can ask your Flowable account manager or contact person to provide a license including the Flowable Inspect component.
When a license with the Flowable Inspect component is present, then Flowable Inspect is still disabled by default. Flowable Inspect provides a set of REST endpoints that allows authenticated users to have access to all Case, Process and Task information, independent of the user's permissions. This is necessary to make it possible to debug and test the case and process models. For development and test environments this is generally not a problem, and Flowable Inspect can be enabled for these environments by setting the configuration property: flowable.inspect.enabled=true.
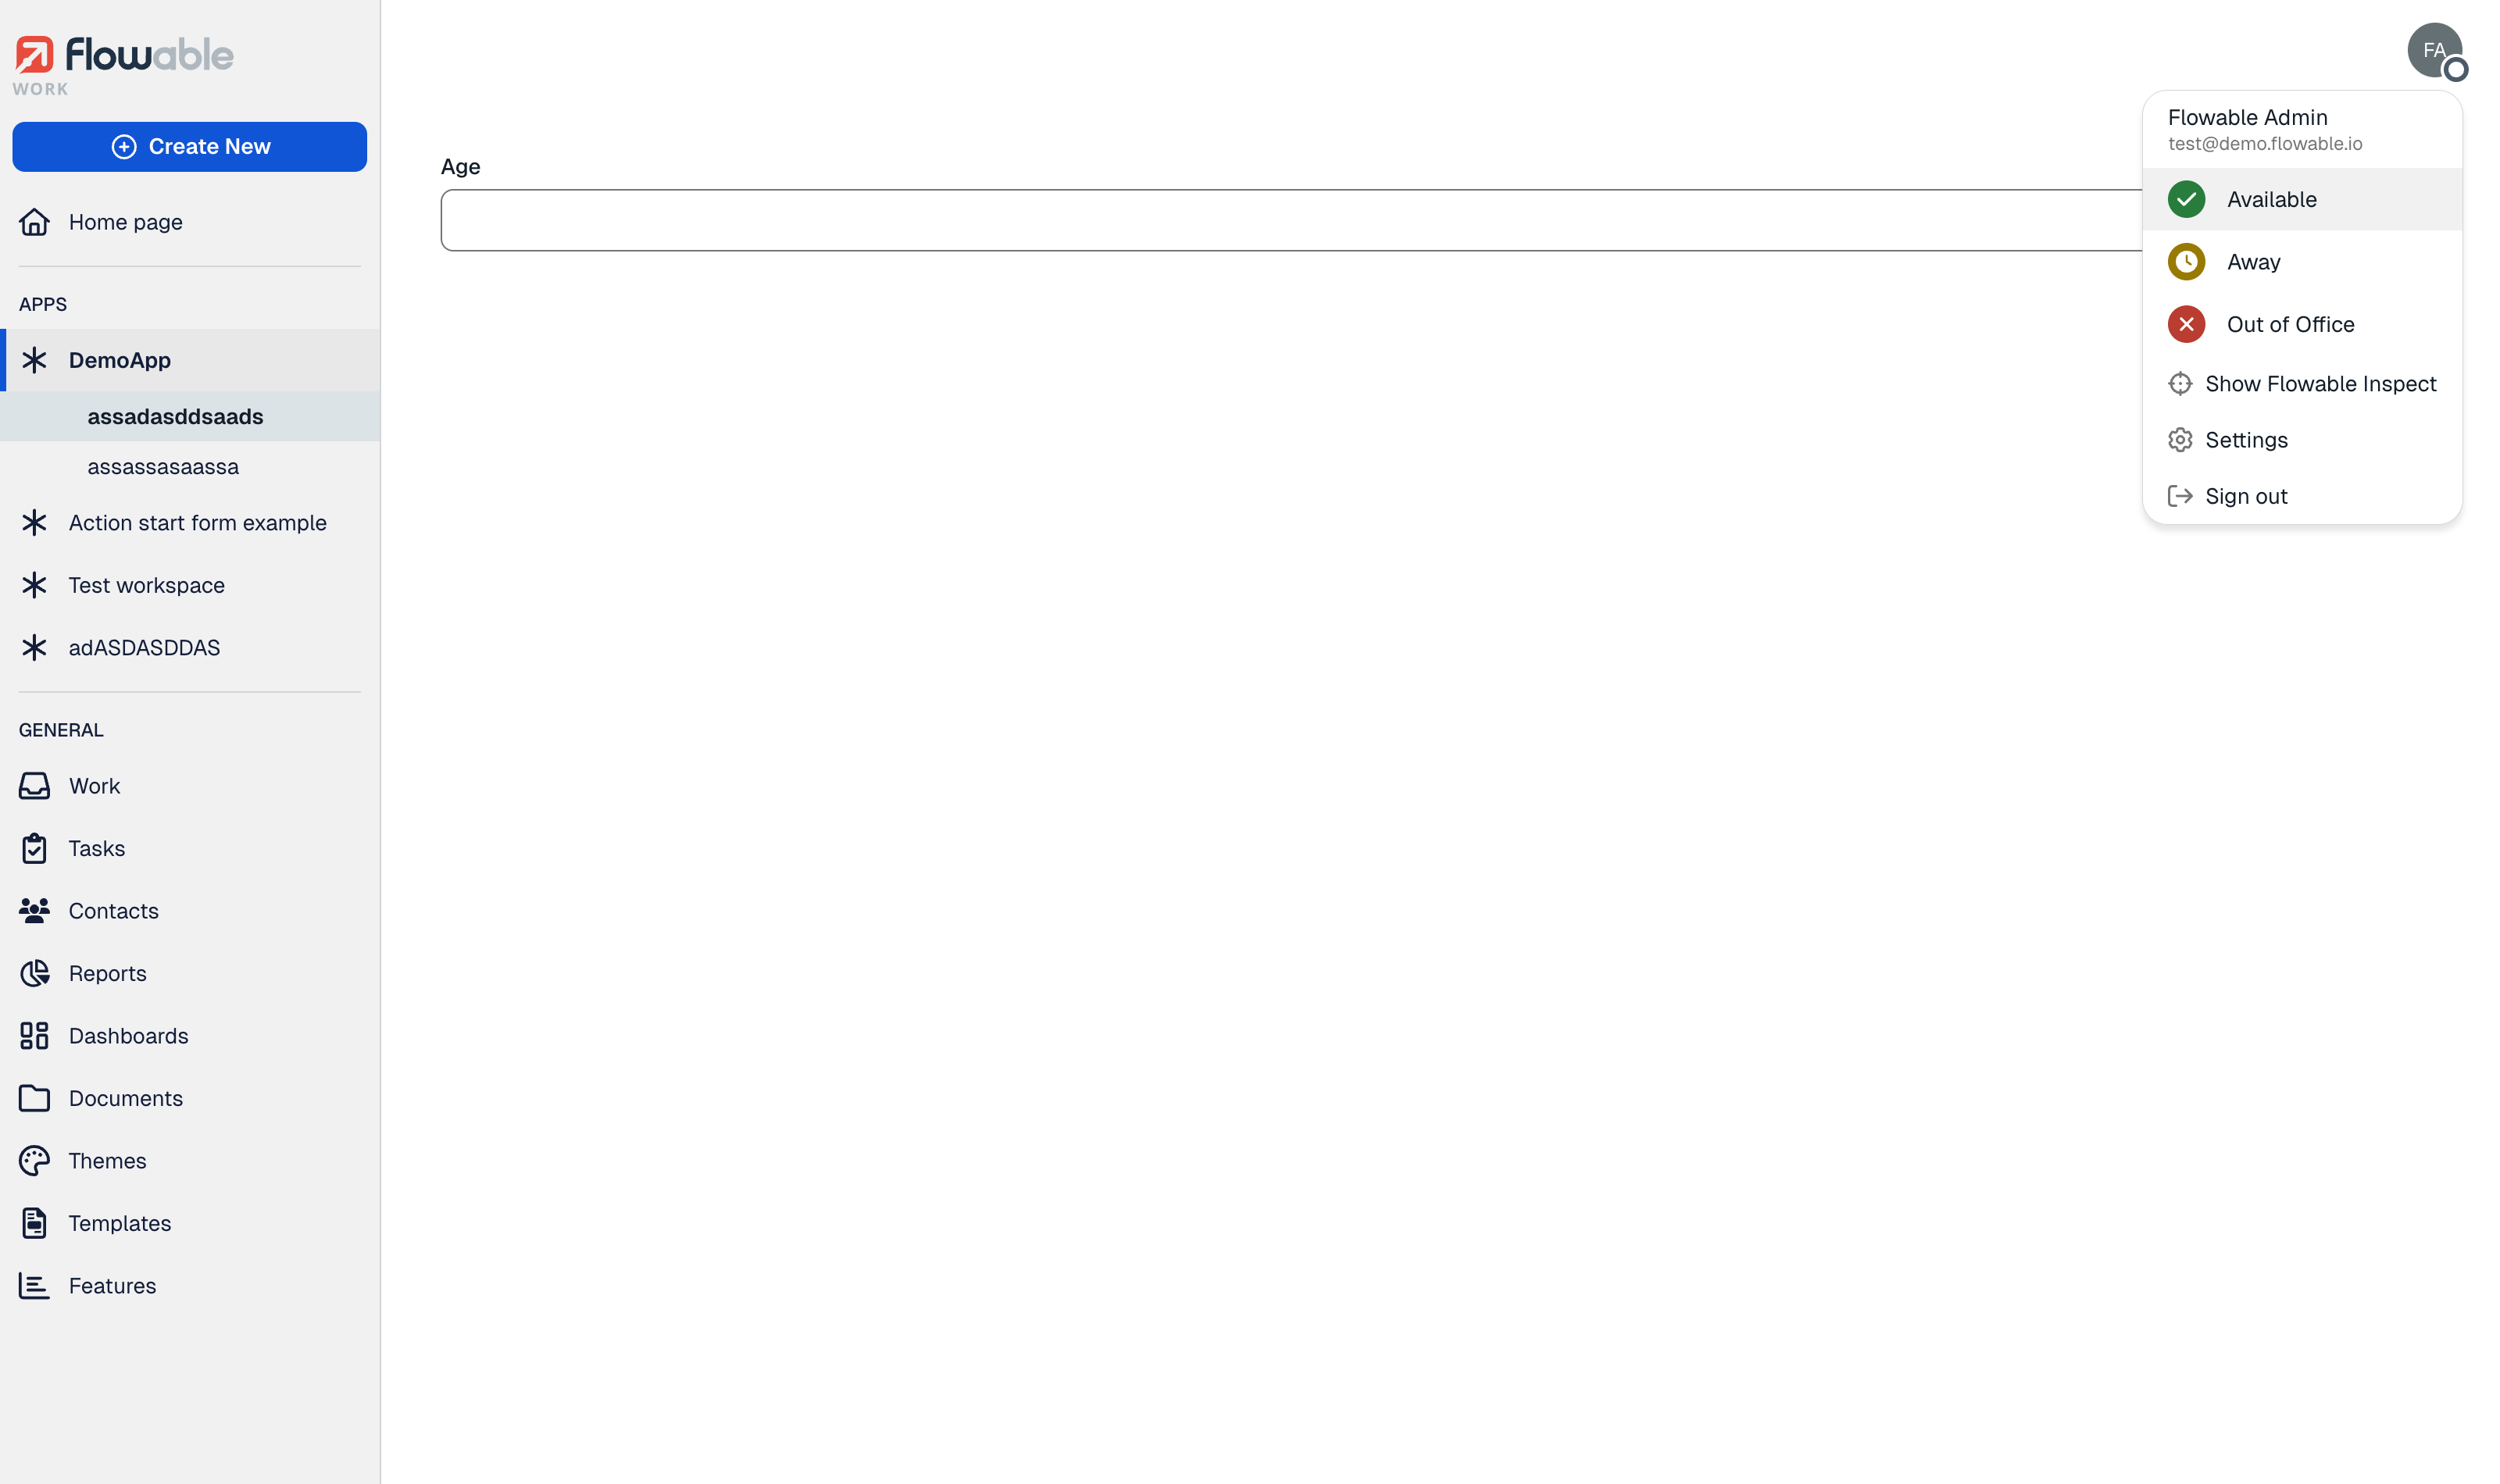
With Flowable Inspect enabled you can open the Flowable Inspect view from the user menu in the top-right corner of the Flowable Work UI, by selecting Show Flowable Inspect.
If you do not have a production license for Flowable Work, but have a Flowable Inspect license, you will also have a development license for Flowable Work to be able to access the Flowable Inspect functionality.
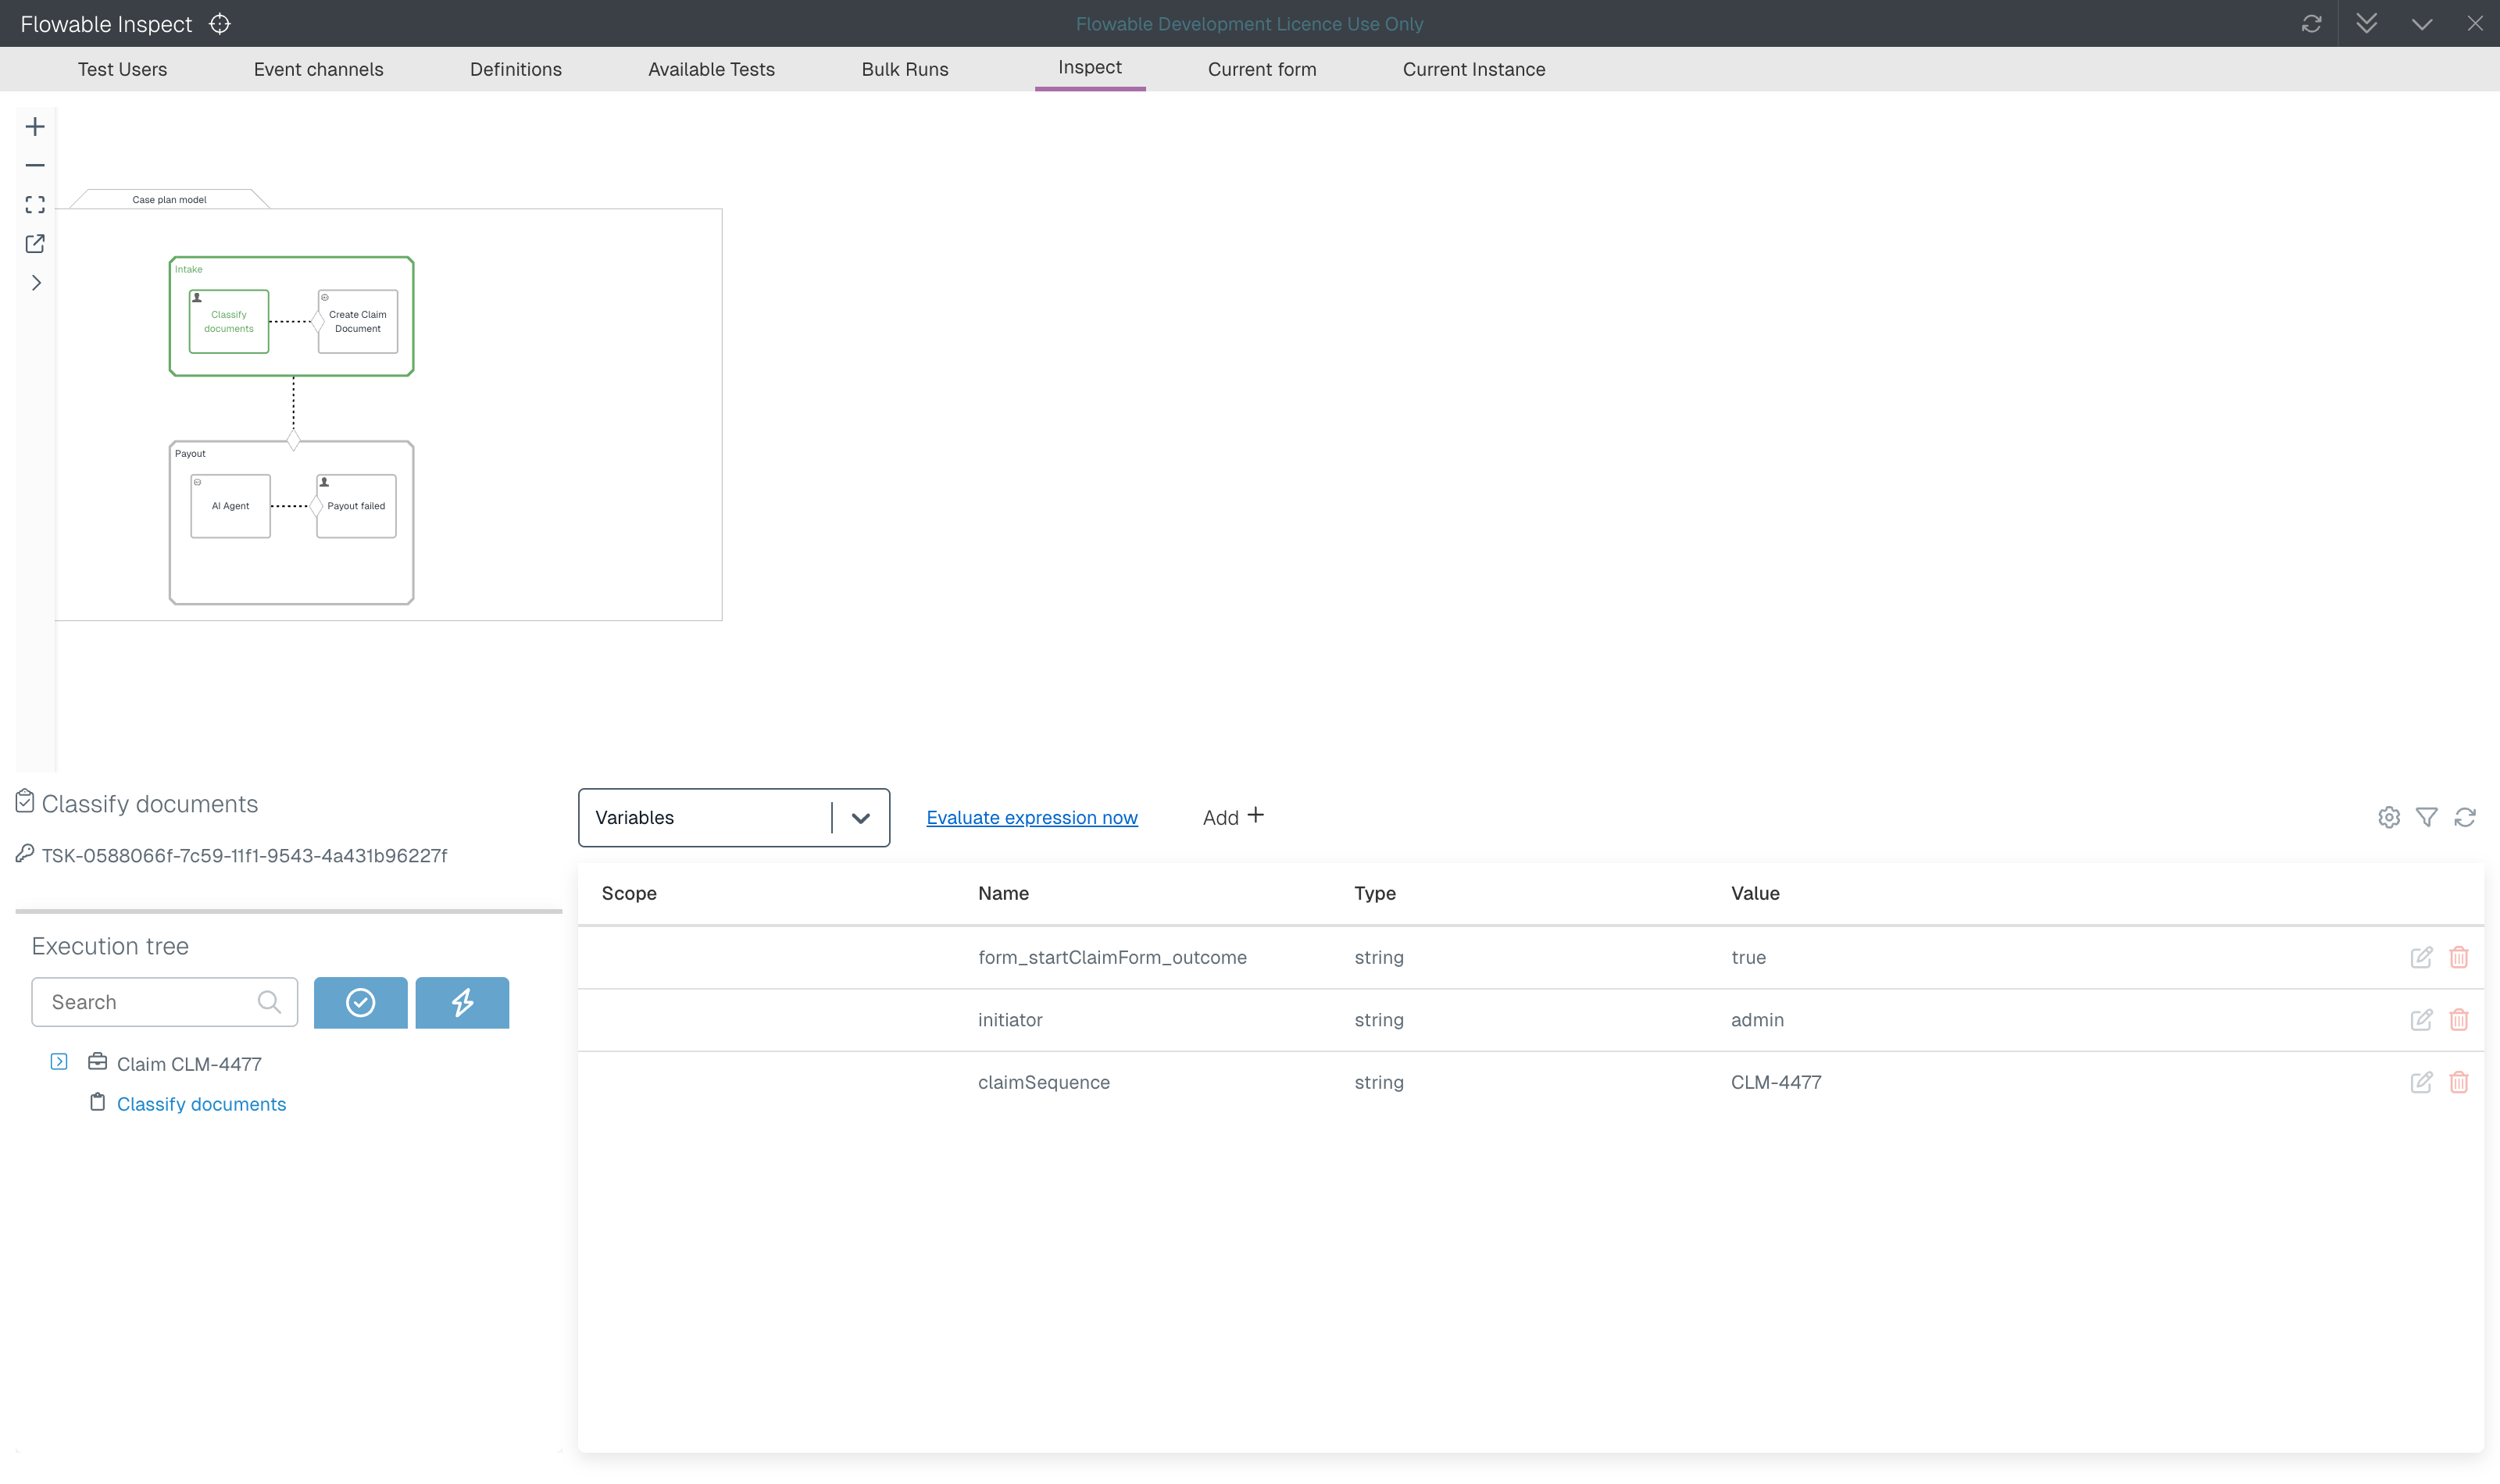
Flowable Inspect then opens as a panel docked at the bottom of the Flowable Work UI, and remains open until you close it again with the close icon in its title bar. The panel can be collapsed, expanded to full height and refreshed with the icons on the right of its title bar. Along the top it provides a set of tabs:
- Inspect – the main debugging view, with the execution tree, the diagram and the context information for the current instance.
- Current form – the form debugger console for the form that is currently active in the Flowable Work UI.
- Available Tests – the list of recorded test models that can be run, exported or imported.
- Bulk Runs – run a selection of test models together and review the aggregated results.
- Definitions – look up the deployed case, process and other definitions.
- Event channels – inspect the configured inbound and outbound event channels.
- Test Users – switch the user context that is used while testing.
Debugging with Flowable Inspect
In this section we will have a closer look at the debugging capabilities of Flowable Inspect. There are various tabs of information available within the Flowable Inspect view.
Inspect execution tree
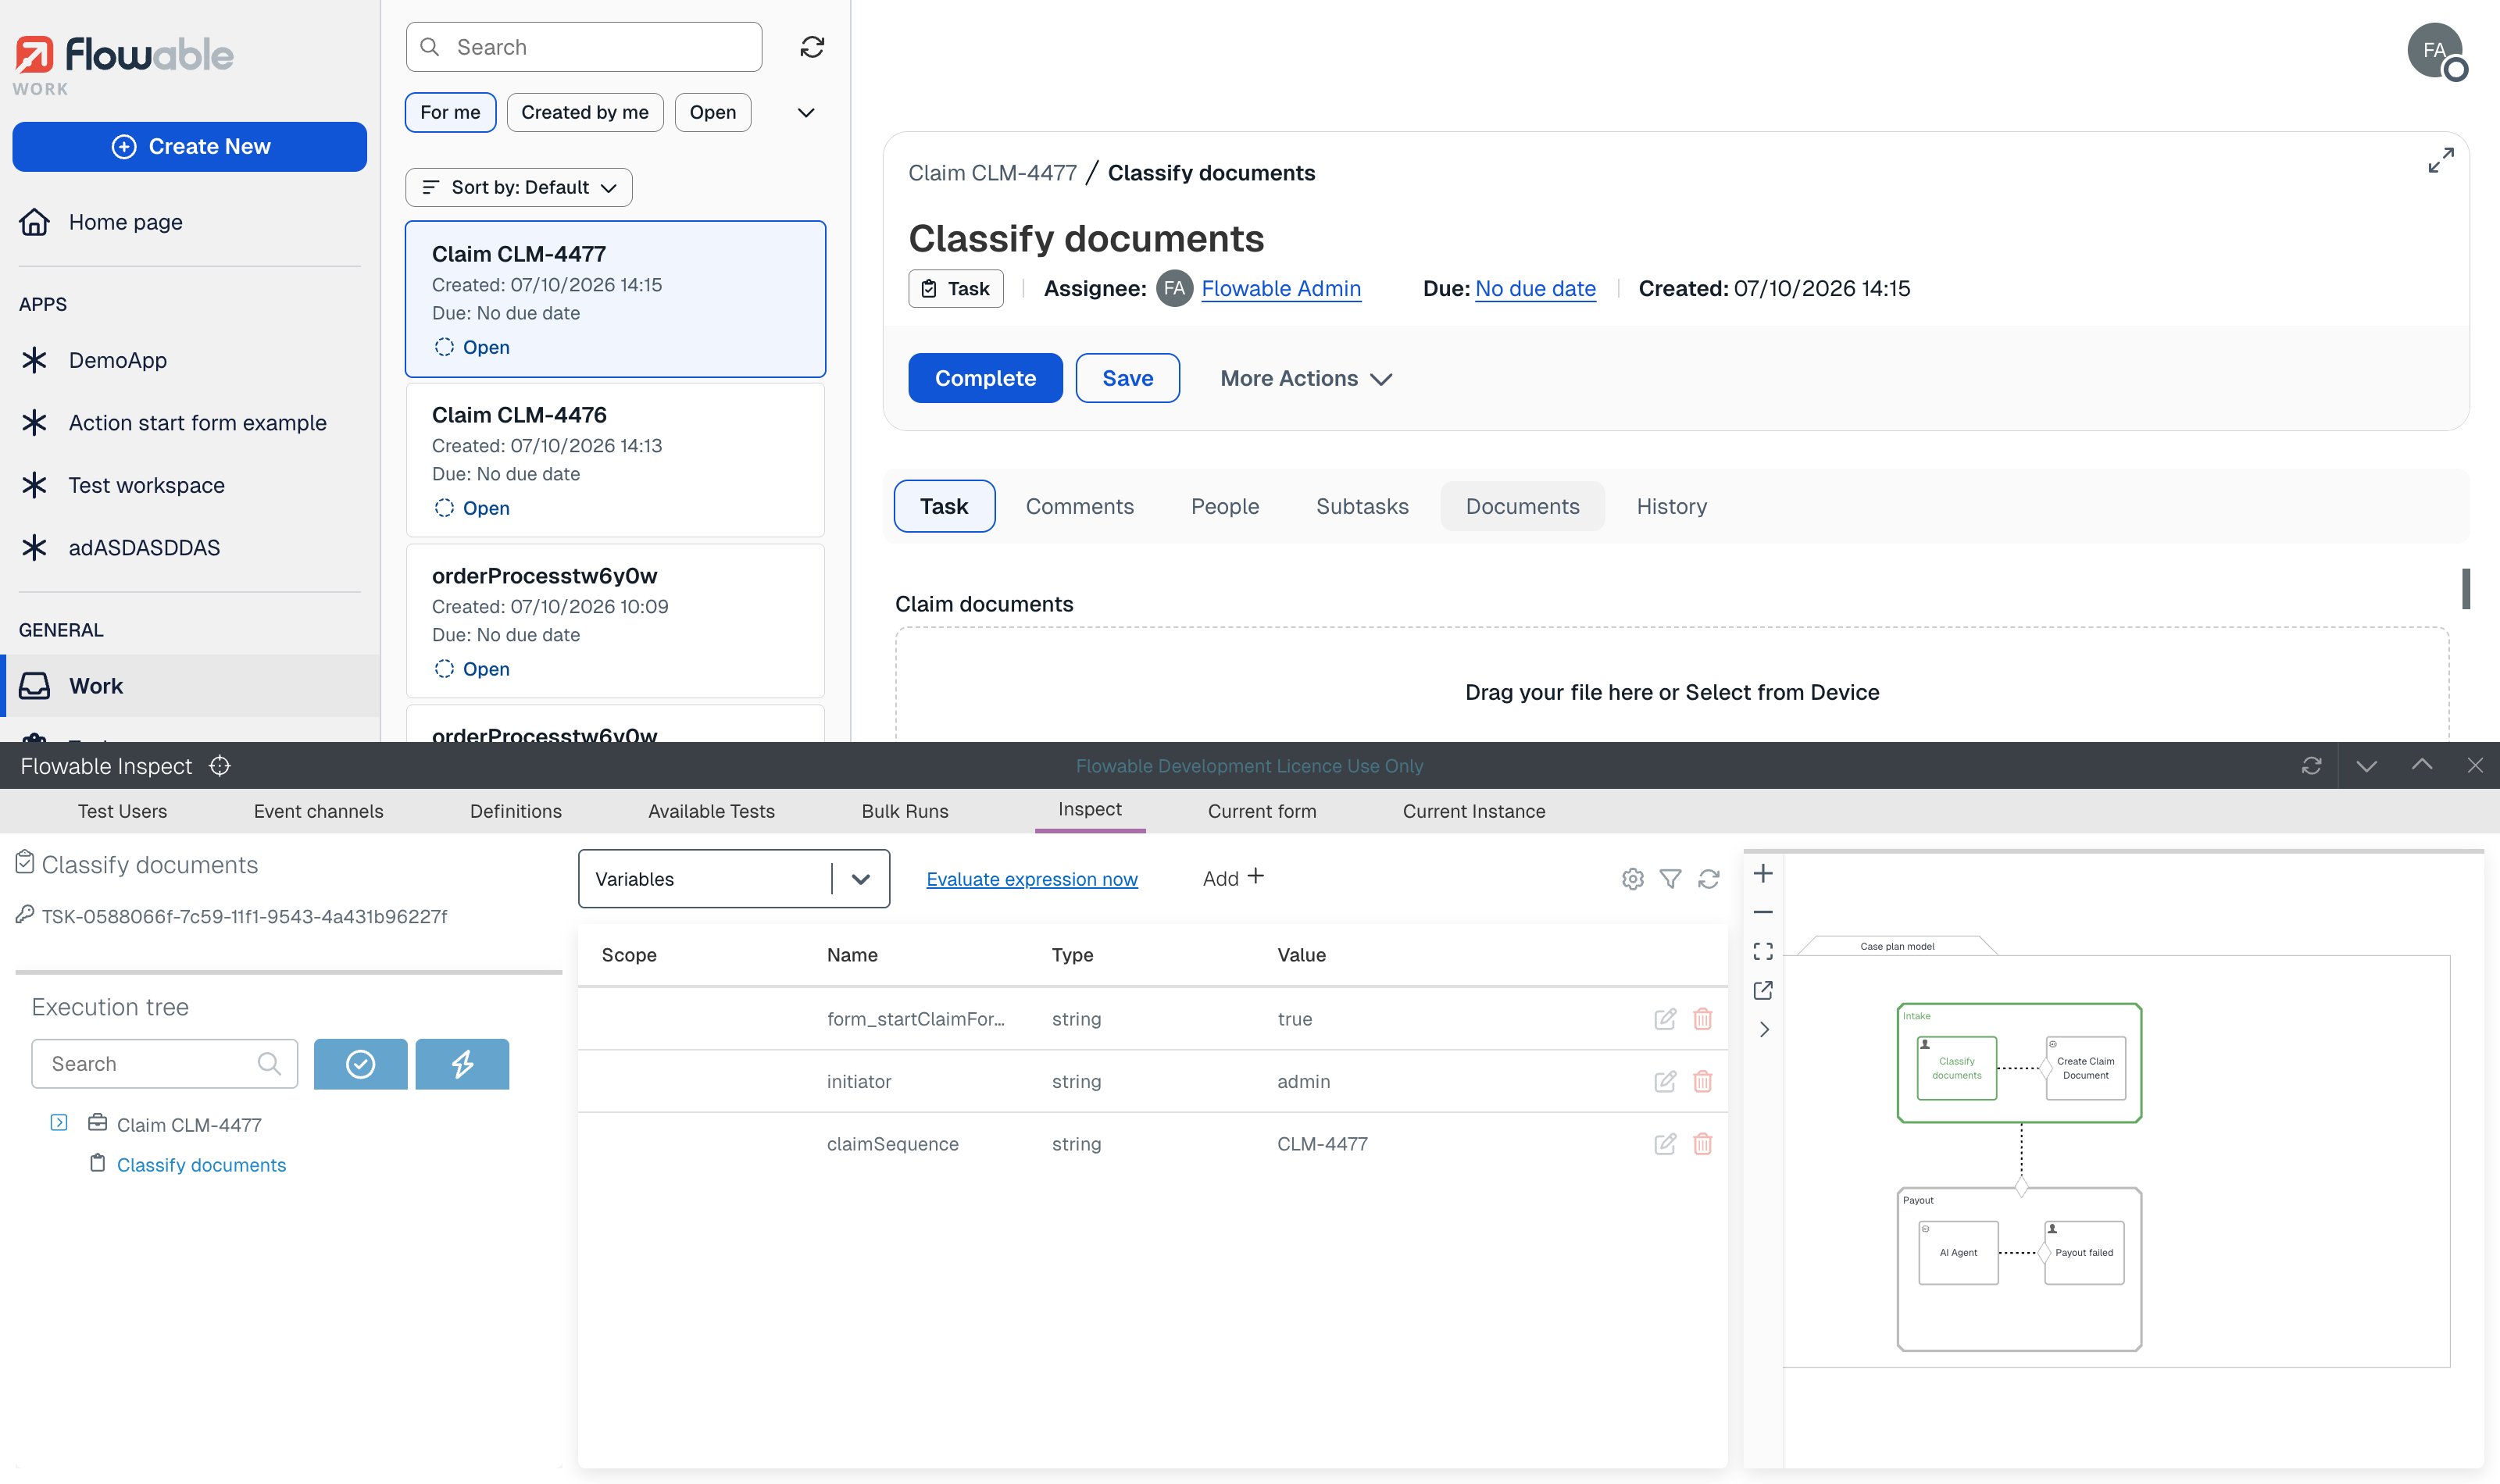
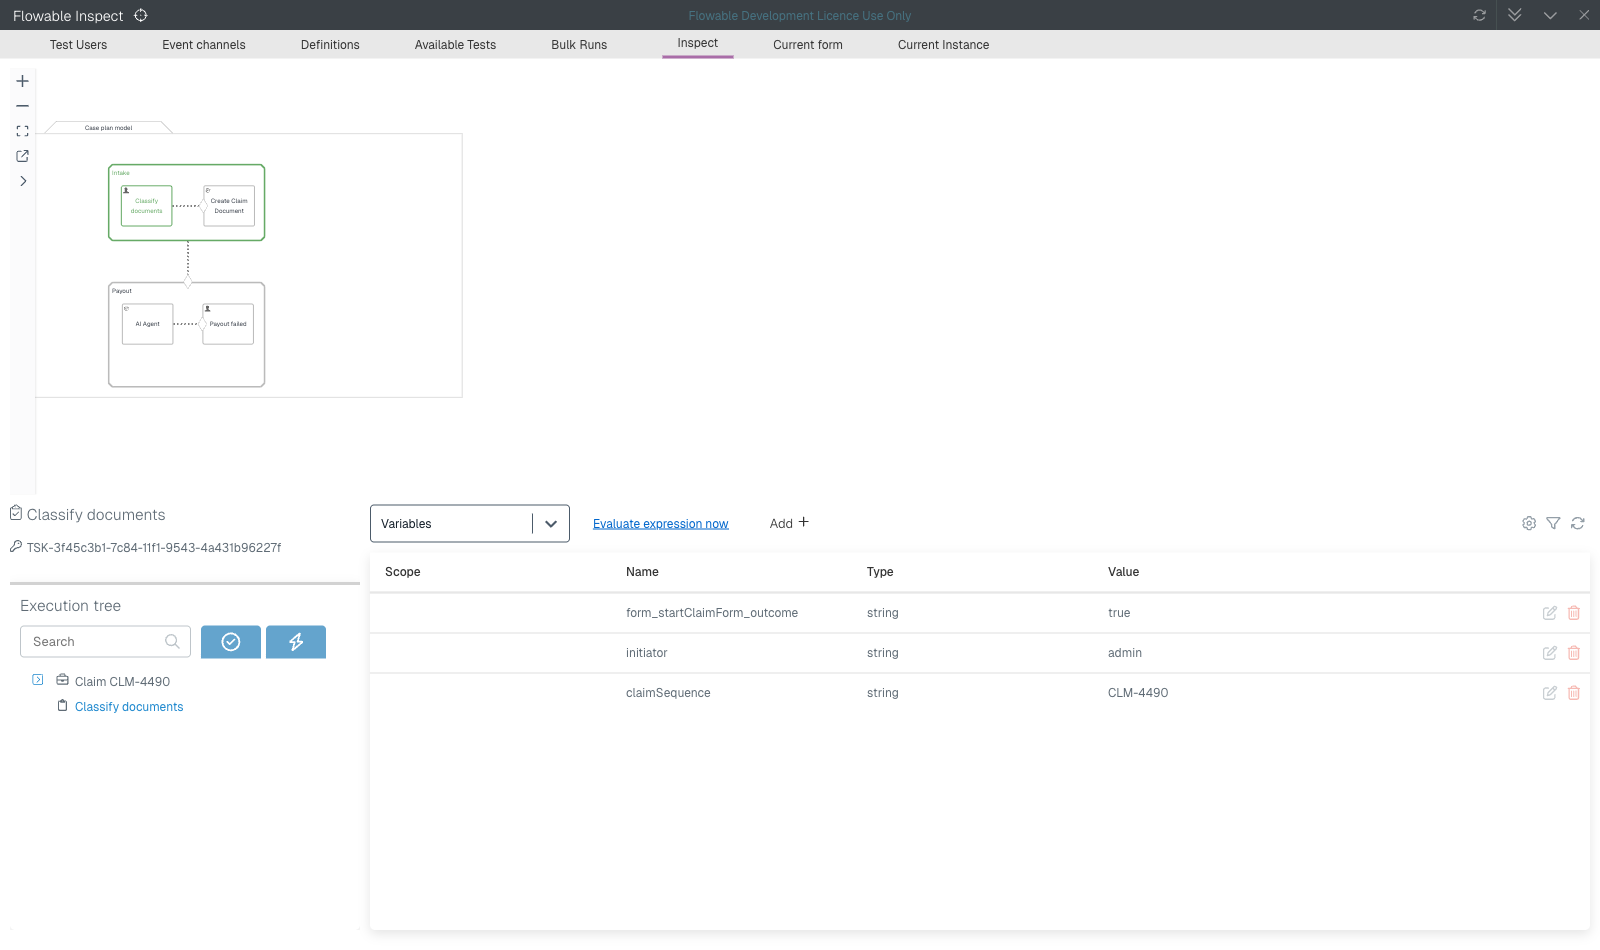
When the Flowable Inspect view is open, navigating to a case instance or process instance in the Flowable Work UI will trigger the Inspect view to follow this navigation. In the example below, we navigated to a case instance named Inspect root case in the Flowable Work UI, and then the Inspect dialog automatically showed information about this case instance.
First, we will focus on the execution tree panel in the Inspect tab that shows a tree of the root case or process instance with all its sub process, sub case and task children. In other words, the execution tree provides an overview of the children that are available under the root instance.
The execution tree also provides an easy way to navigate between sub case and process instances, tasks and the root instance. By clicking on the task item named Root task, the Flowable Work UI will navigate to this task.
Inspect diagram panel
In the Inspect view, there's always a graphical representation of the case or process instance in the current context shown. When navigating to a task, the case or process diagram containing this task is shown. The diagram can be enlarged by clicking on the button at the top left menu of the diagram.
Now the diagram is shown in the top half of the page and the Inspect dialog becomes full page. The diagram can be further enlarged or reduced with the zoom buttons in the menu to the left. The diagram provides navigation capabilities, for example, to show a sub process model of a call activity or show a sub case model of a case task. In the following example, the process task in the diagram has been clicked and a menu popped up that shows a Navigate to option to navigate to the sub process instance.
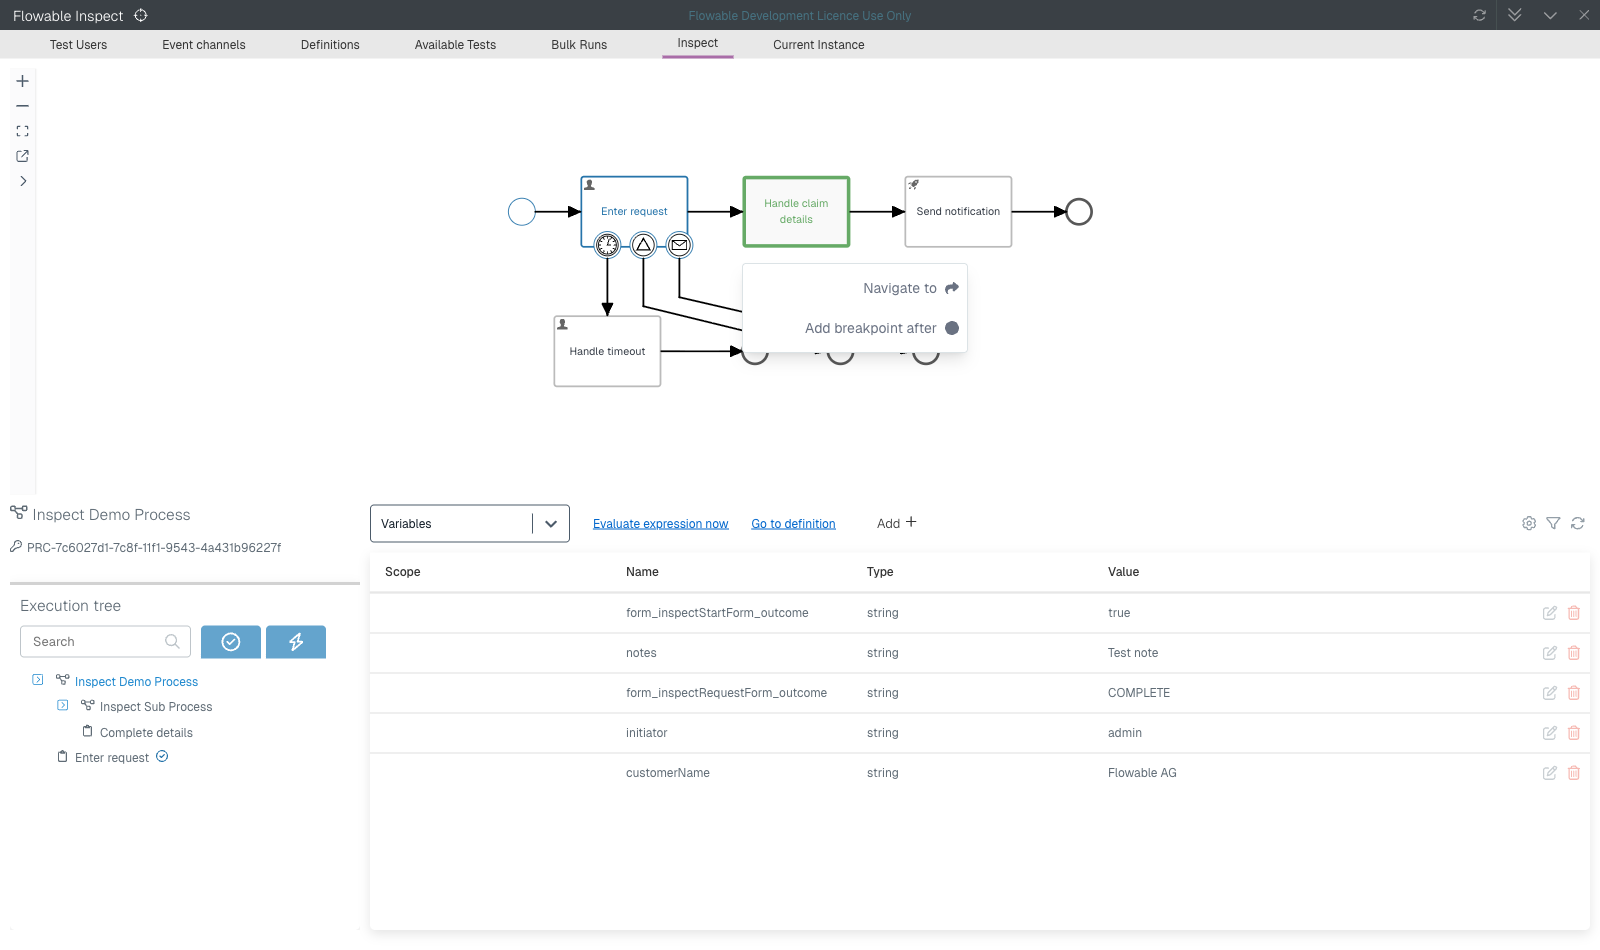
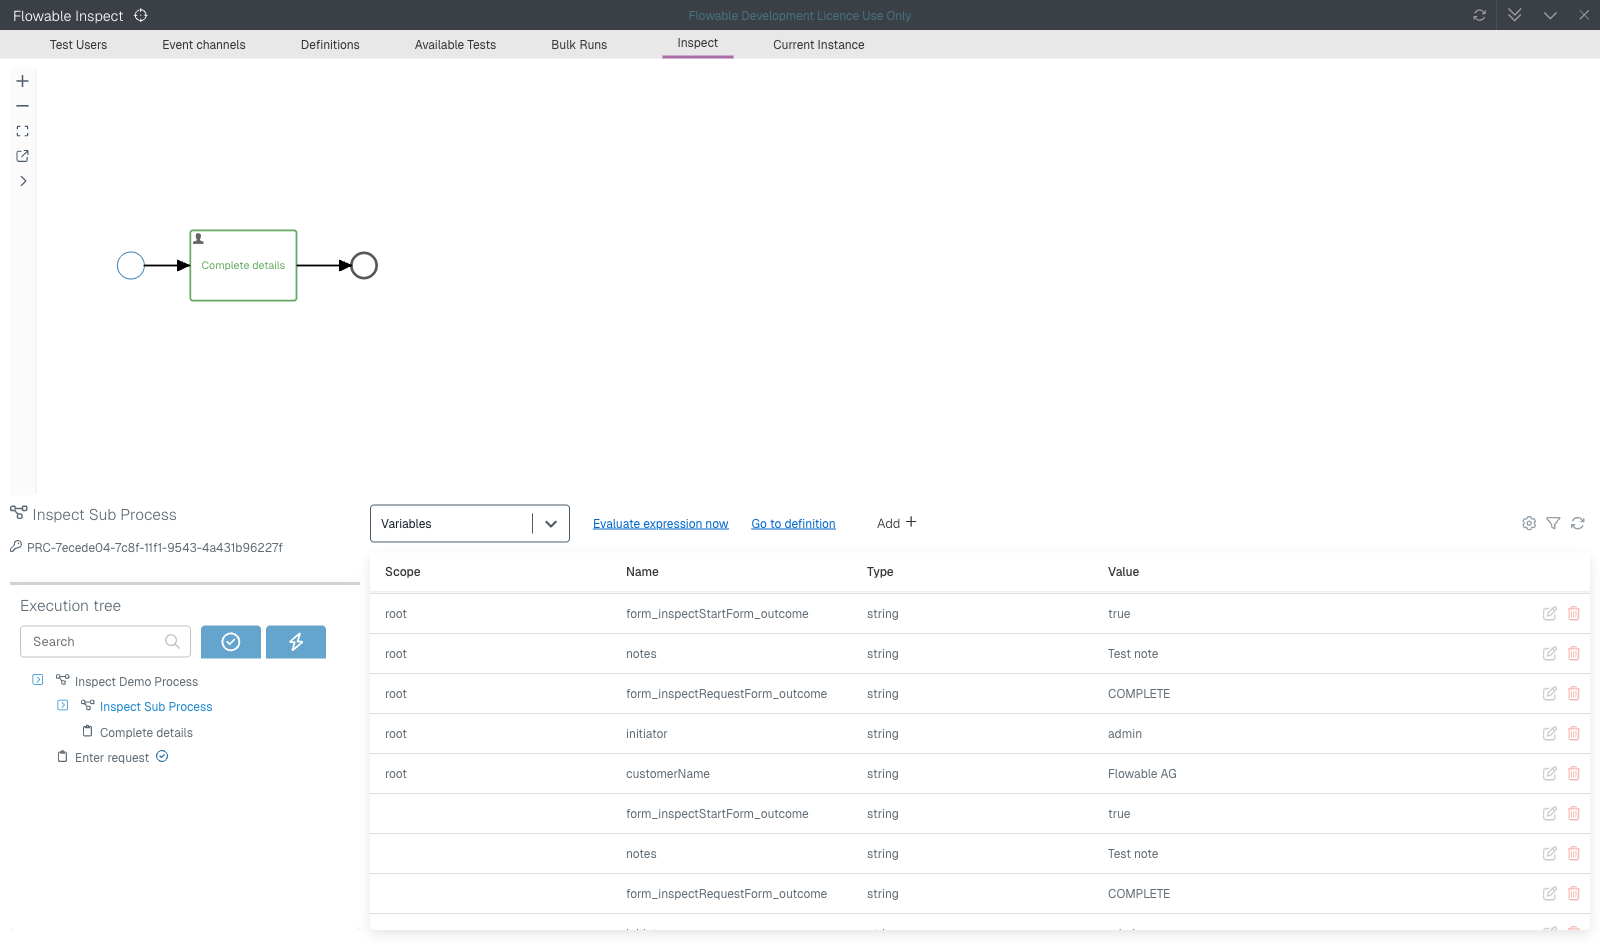
After clicking the Navigate to option, the Inspect view context shifts to the sub process instance and that diagram is shown with its execution tree and variable context.
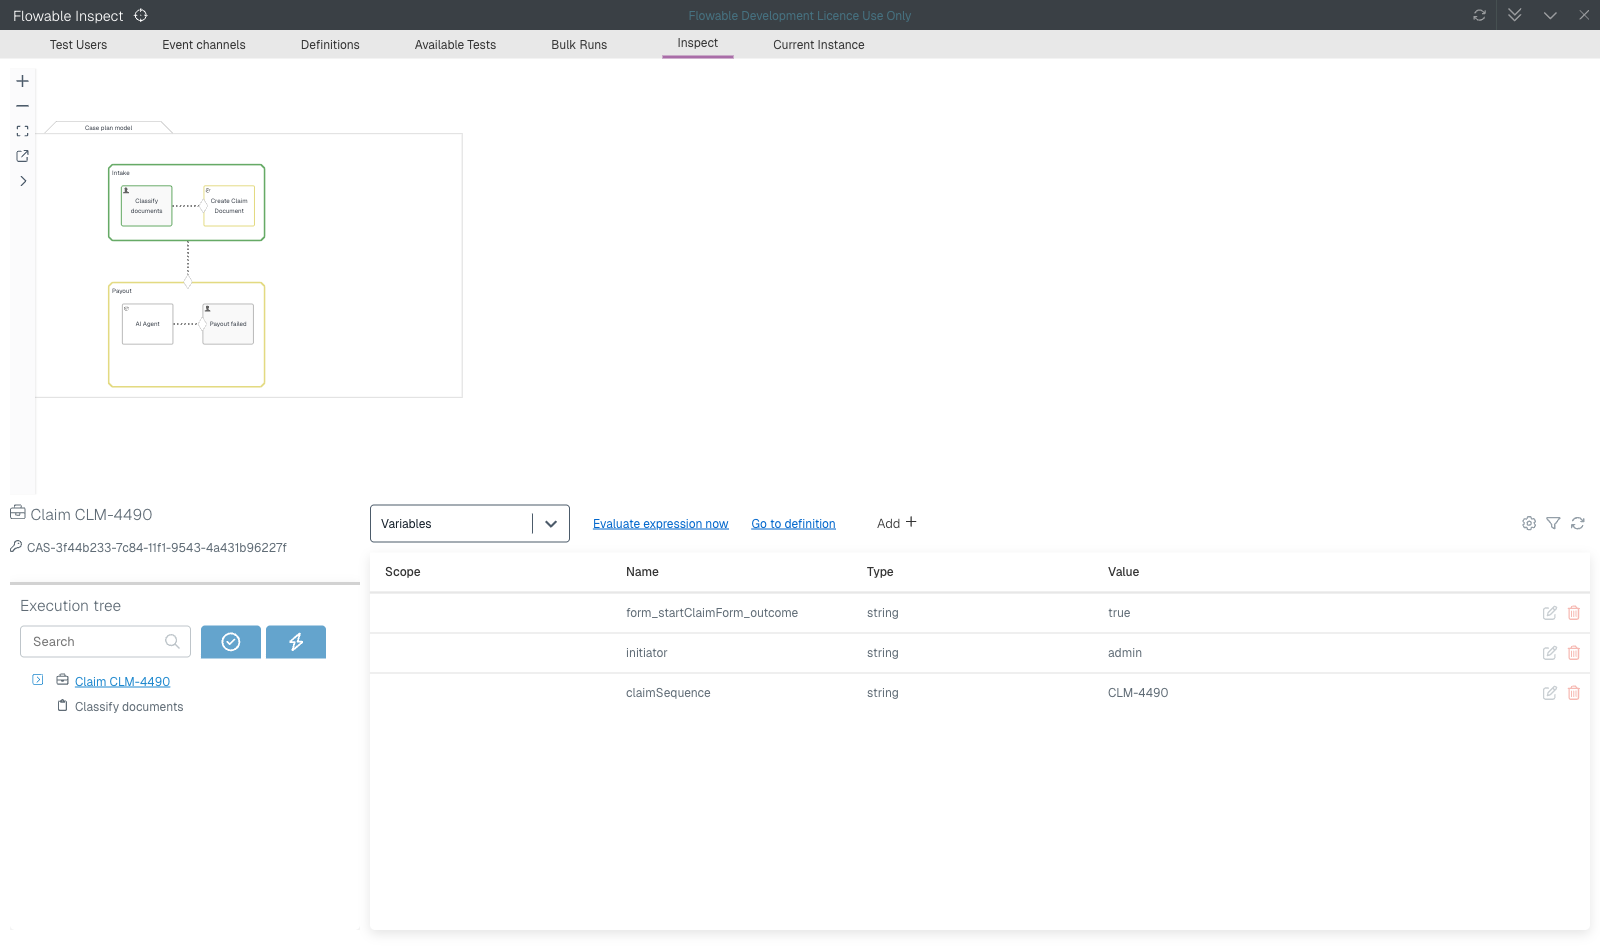
The execution tree now provides an easy way to navigate back to the root case instance. The diagram allows users to navigate to running instances, but also to sub case or process models that are completed or were not even yet created. When navigating to a process model for a process task that has not yet been executed, the scope of Inspect tab remains on the previous instance scope. This means the execution tree and the variables list will still show the previous instance scope. However, the diagram shows the sub case or process model, to provide some insight into the structure of the model.
In addition to the case and process models it's also possible to view the decision table audit and model views, and form models can be previewed.
Inspect context information
For a case and process instance there's a lot of information available in the Flowable database. In the Inspect tab a lot of this information is provided in the middle panel of the Inspect view. The type of information shown is selected with the dropdown above the panel, which defaults to the list of variables. Which options the dropdown offers depends on what is available for the current instance: in addition to the variable, timer, signal, message, exception, details and plan item information described below, it can also show the activities that were executed, the REST executions performed by the instance, any event registry events, the identity links of the instance, the service registry settings for mocking service calls, and — when the instance invoked one or more AI agents — the agent instances.
Inspect variable list
The variable list shows the available variables within the context of the current scope instance. This means that when the active instance is, for example, the root case instance, all the variables of this case instance will be shown. In the next example, the current scope is a sub process instance and this shows the variables of the sub process instance itself, but also of the parent and root instances. In this example, there's one root case instance that started the sub process instance.
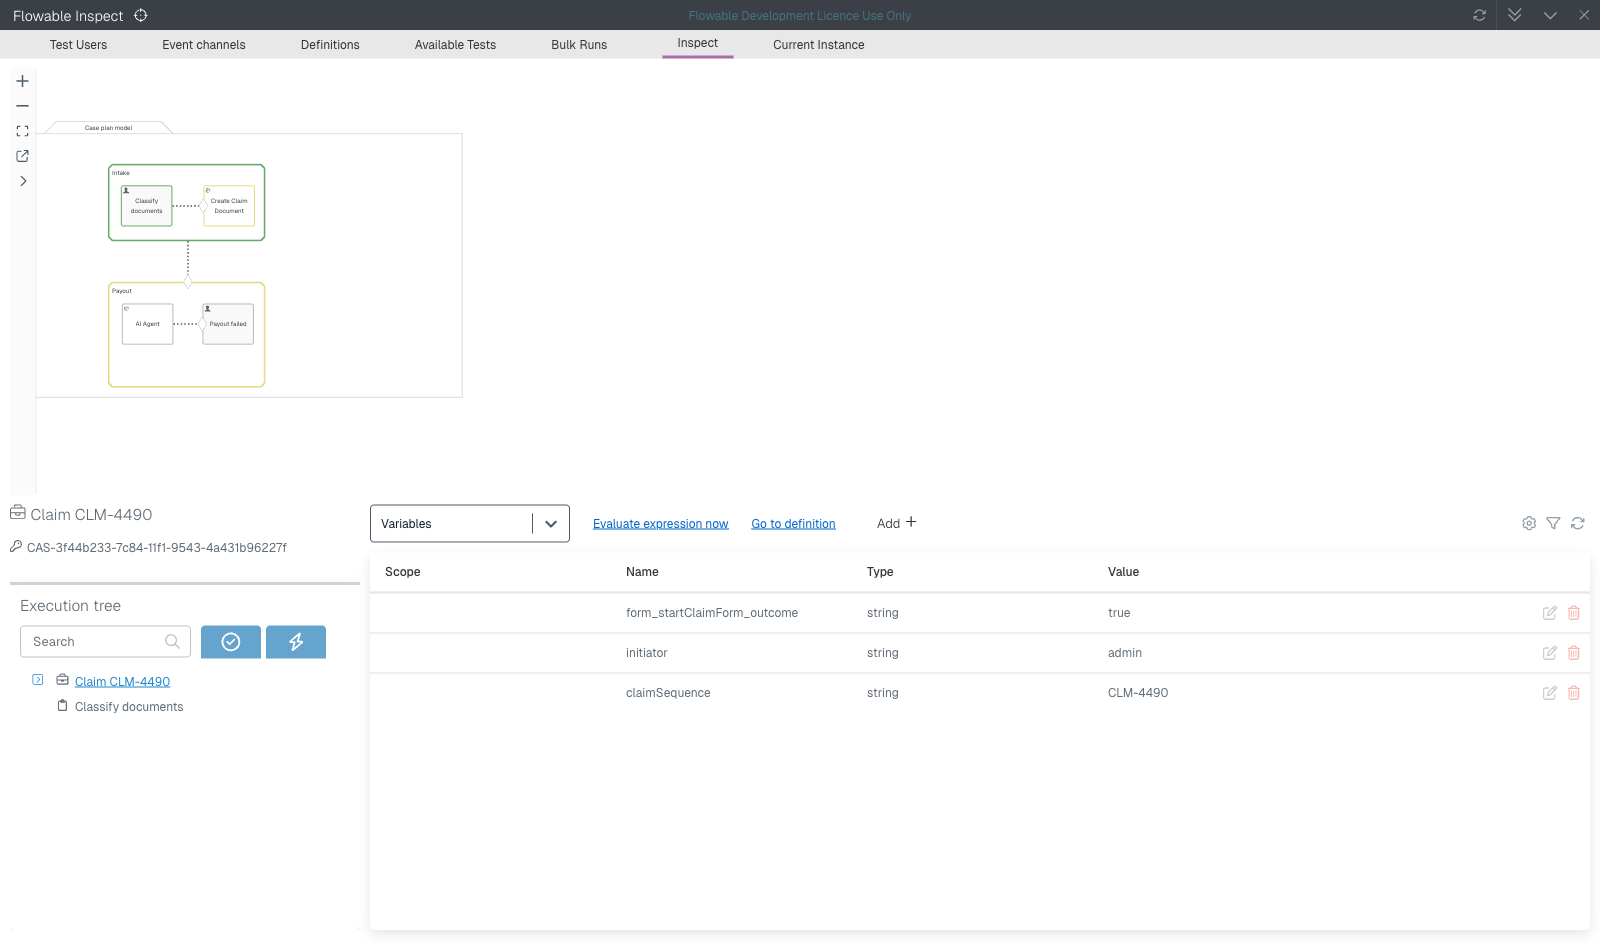
In addition to the variable name, type and value, the scope of a variable is also shown. When there's no value in the scope column this means that the variable is available in the current instance scope and no prefix of root. or parent. is needed. If there's a root value, this means the variable comes from the root case or process instance and is only available when using the root. prefix and also the parent. prefix when there is no other parent of the current instance.
It's also possible to edit and delete a variable with the icons on the right side of a variable row. When editing a variable value, the value will be changed immediately.
Inspect timer job list
The timer job list shows the active timer jobs within the context of the current scope instance. For each timer job, the due date is shown and if a boundary timer event, the activity to which it is attached.
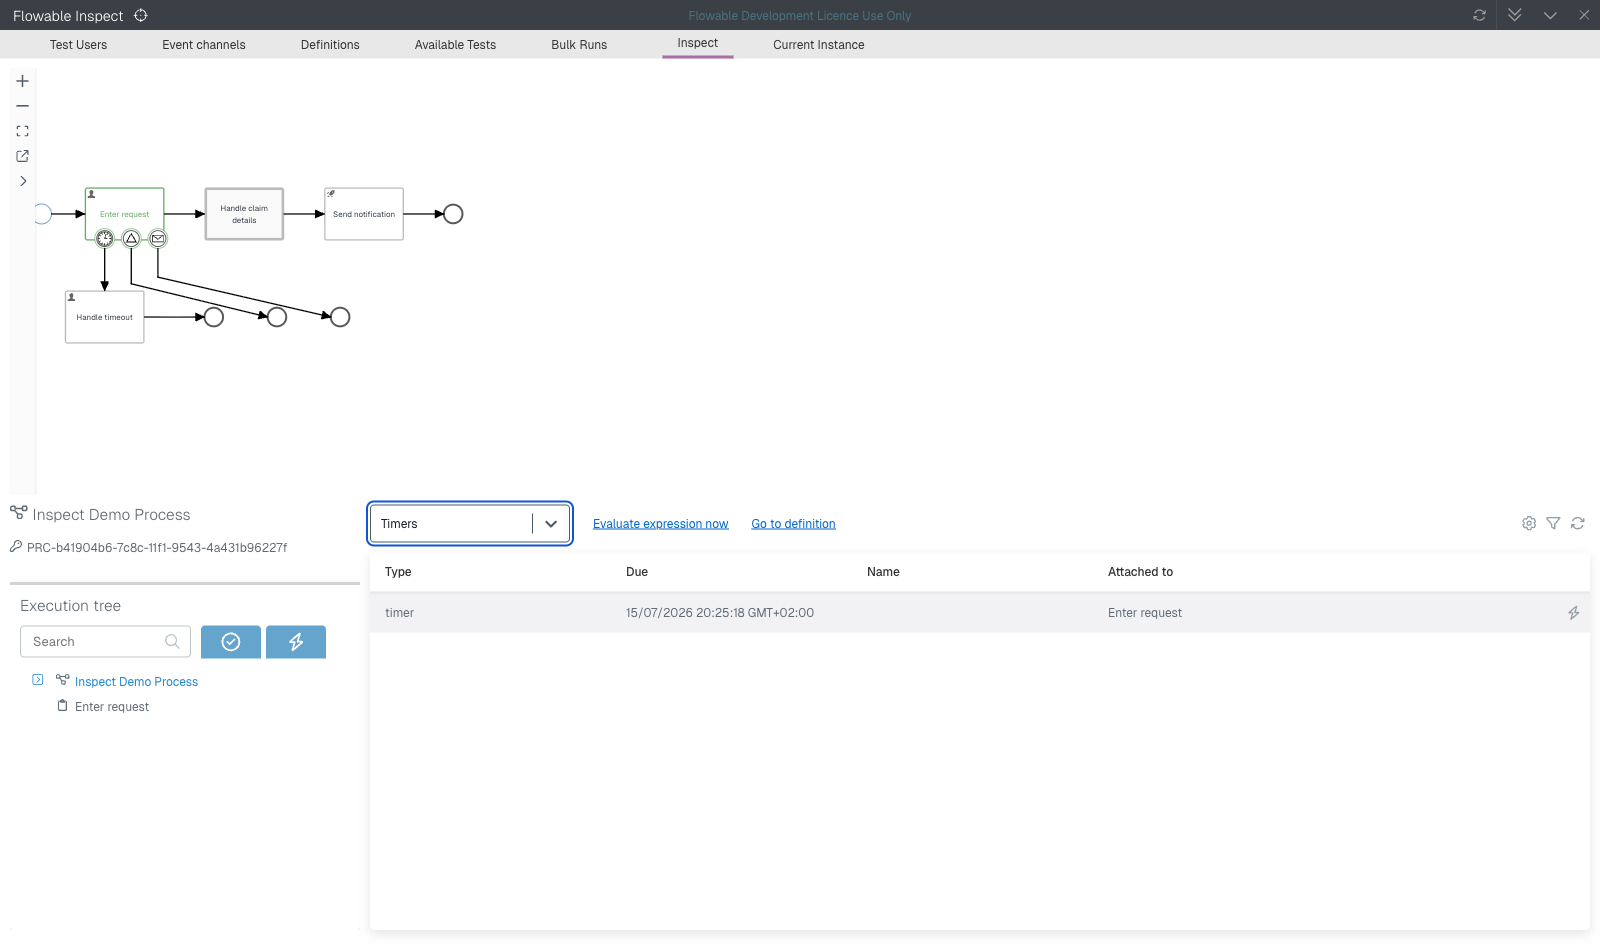
When a timer is due, for example, in a week's time, it's impossible to trigger the timer immediately in the Flowable Work UI to test the timer expiring functionality. Trigger a timer by clicking on the lightning icon on the right side of a timer row.
Inspect signal list
The signal list shows the waiting signal event subscriptions within the context of the current scope instance. For each signal event, the due date is shown and if a boundary signal event, the activity to which it is attached.
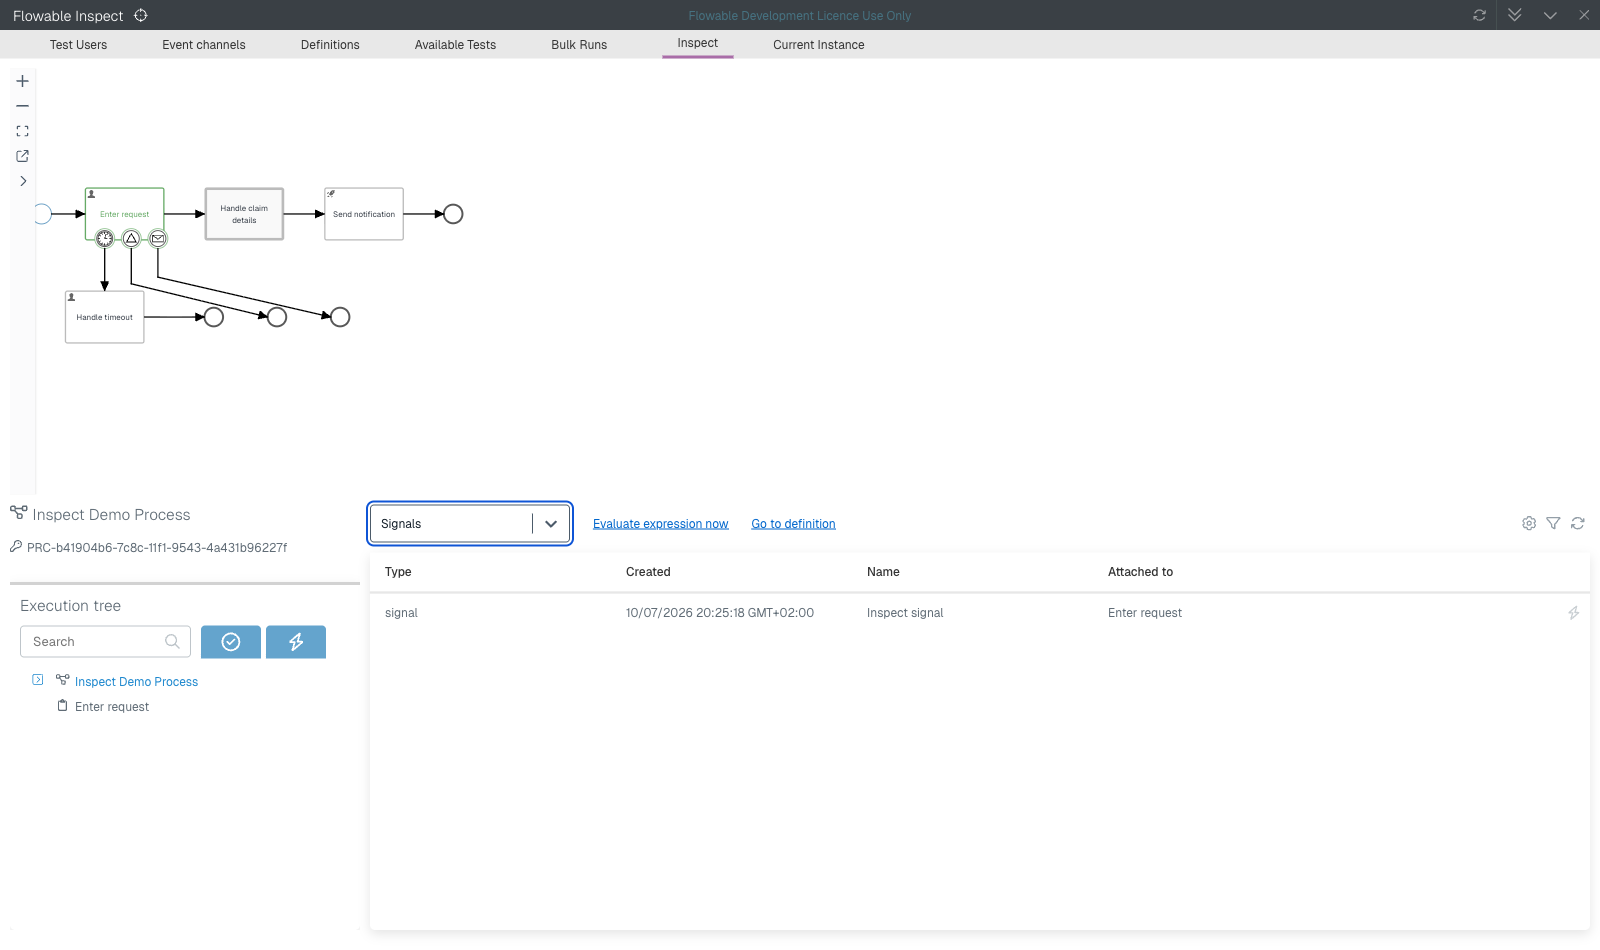
By clicking on the lightning icon on the right side of a signal event row, a waiting signal event can be triggered.
Inspect message list
The message list shows the waiting message event subscriptions within the context of the current scope instance. For each message event, the due date is shown and if a boundary message event, the activity to which it is attached.
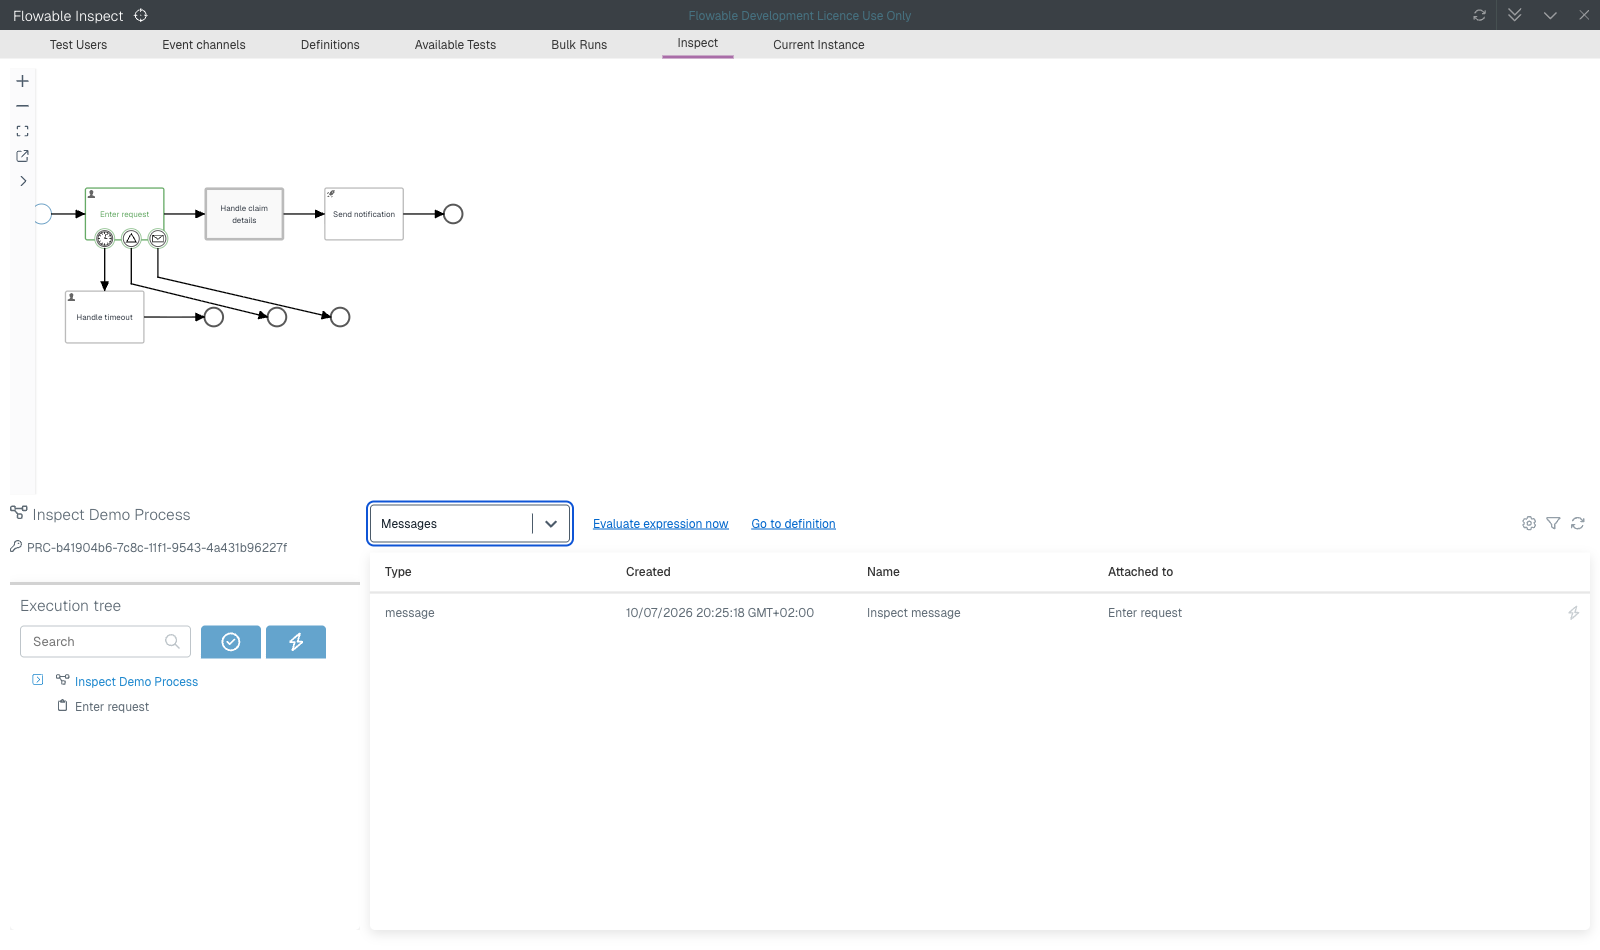
By clicking on the lightning icon on the right side of a message event row, a waiting message event can be triggered.
Inspect exceptions list
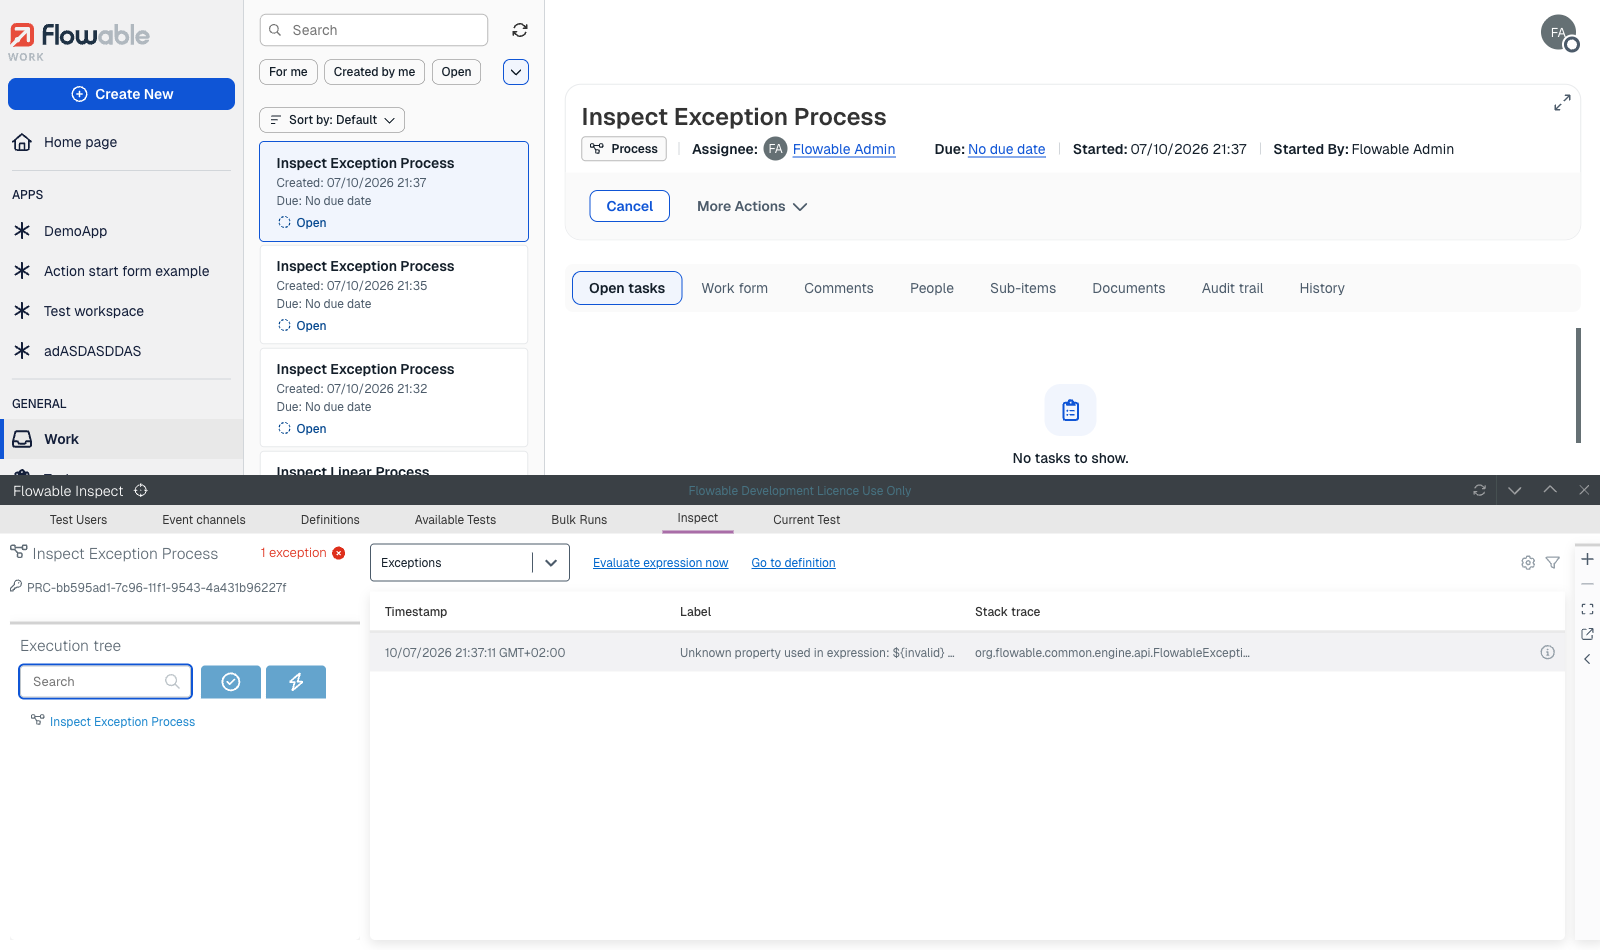
The exceptions list is a more significant feature than may appear at first sight. Usually, when an exception happens while you are testing or stepping through a case or process instance, this exception will be logged in the server log and you can analyse the logging to see what happened exactly. When Flowable Inspect is enabled, the exception will also be logged and saved in the context of the case or process instance where the error happened. The error information is available in the Exceptions section and also a visual indication is shown on the left side of the Inspect tab to mark that an exception happened for the current active instance.
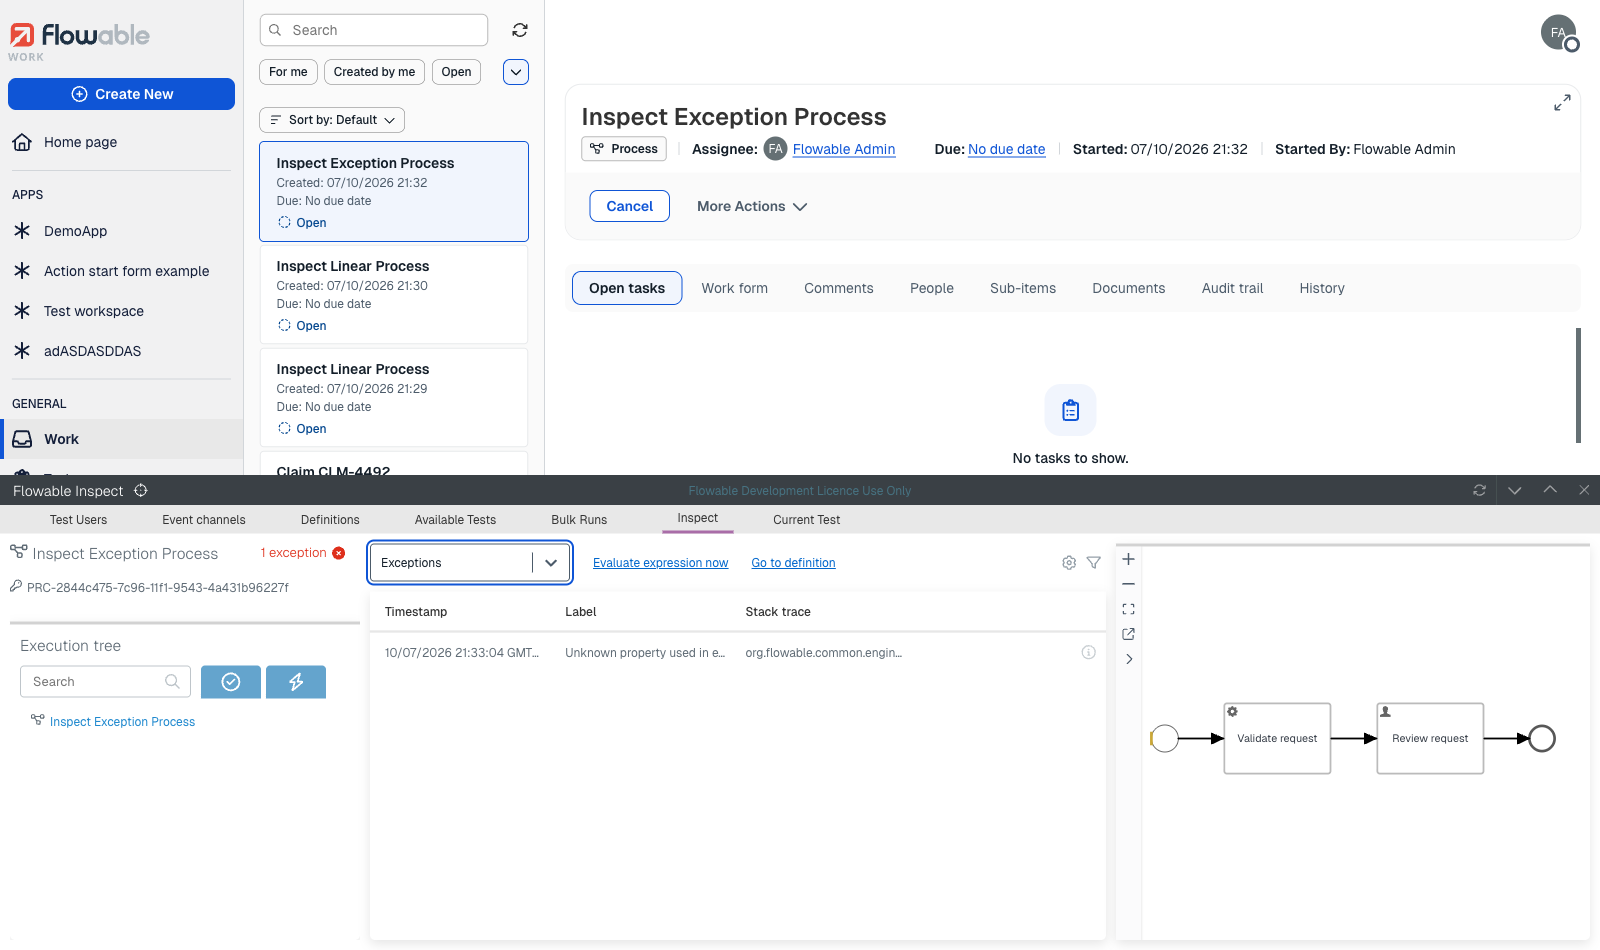
All exceptions for the current active instance are available in the table. When clicking on the info icon on the right side of an exception row, the full details of the exception message are shown with the full stack trace.
Inspect details info
The details section is a bit different from the other options for context information. This section shows detailed information including the instance ID, tenant ID start user, the definition name and the identity links.
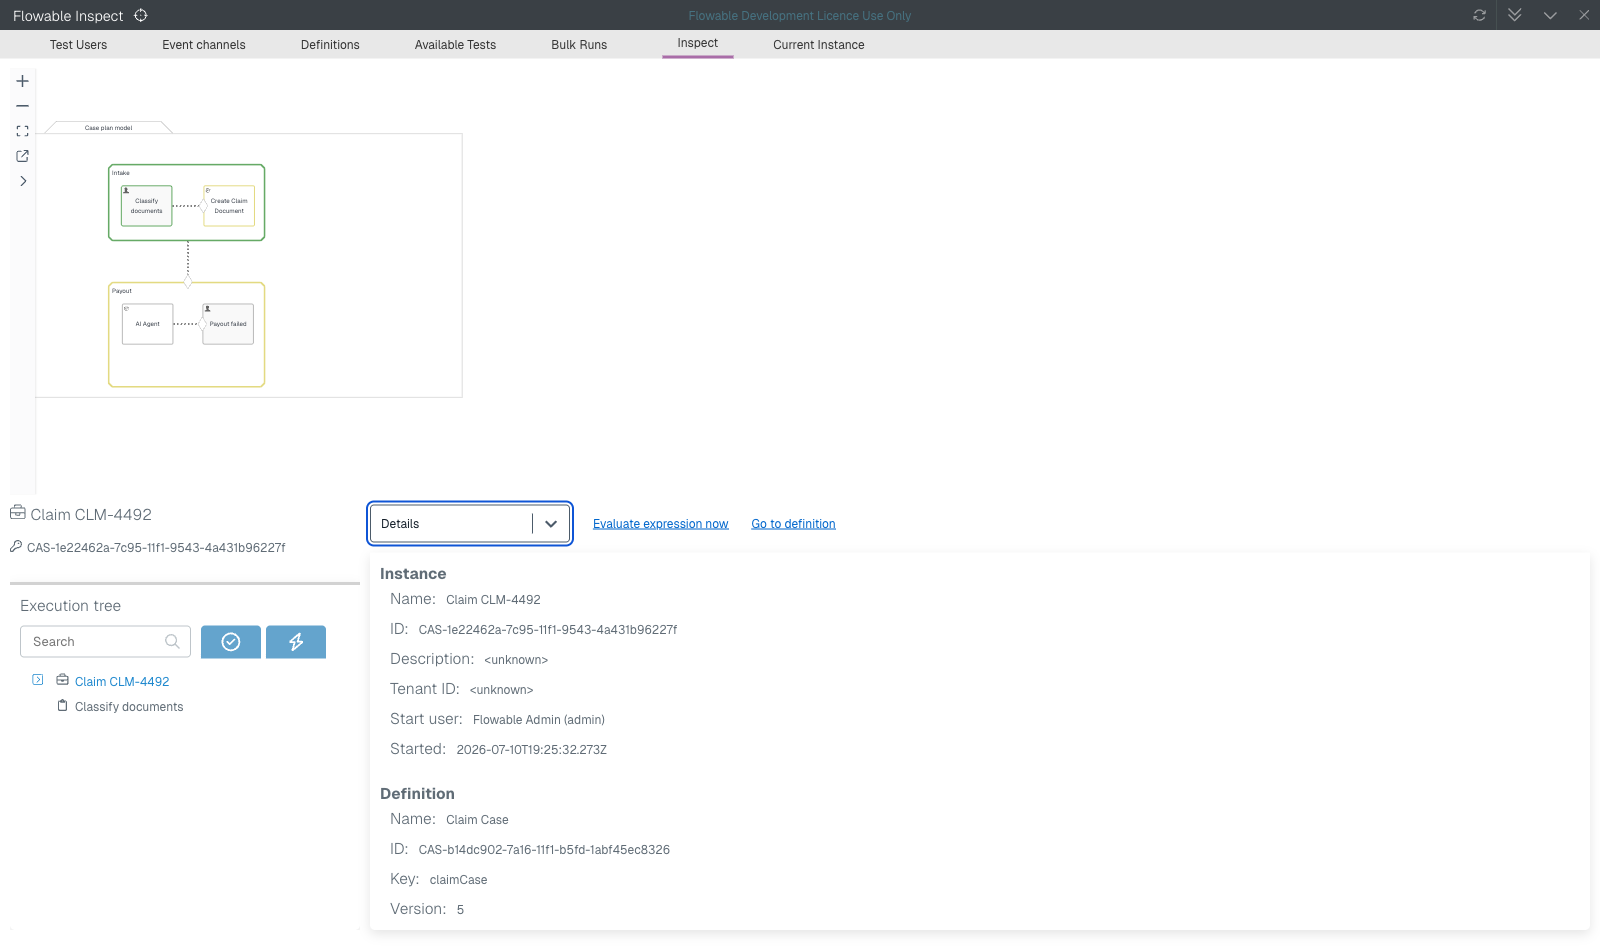
When having to look up an instance value in the Flowable database, or when you are looking for the identity links / roles involved in the instance, the details section can be used to lookup the information for a specific instance.
Inspect plan item list
The plan item list shows the plan item instances that are currently in a non-ended state for a case instance. With different colours the state information for each non-ended plan item is shown, with green for active, dark yellow for enabled and light yellow for available plan item instances.
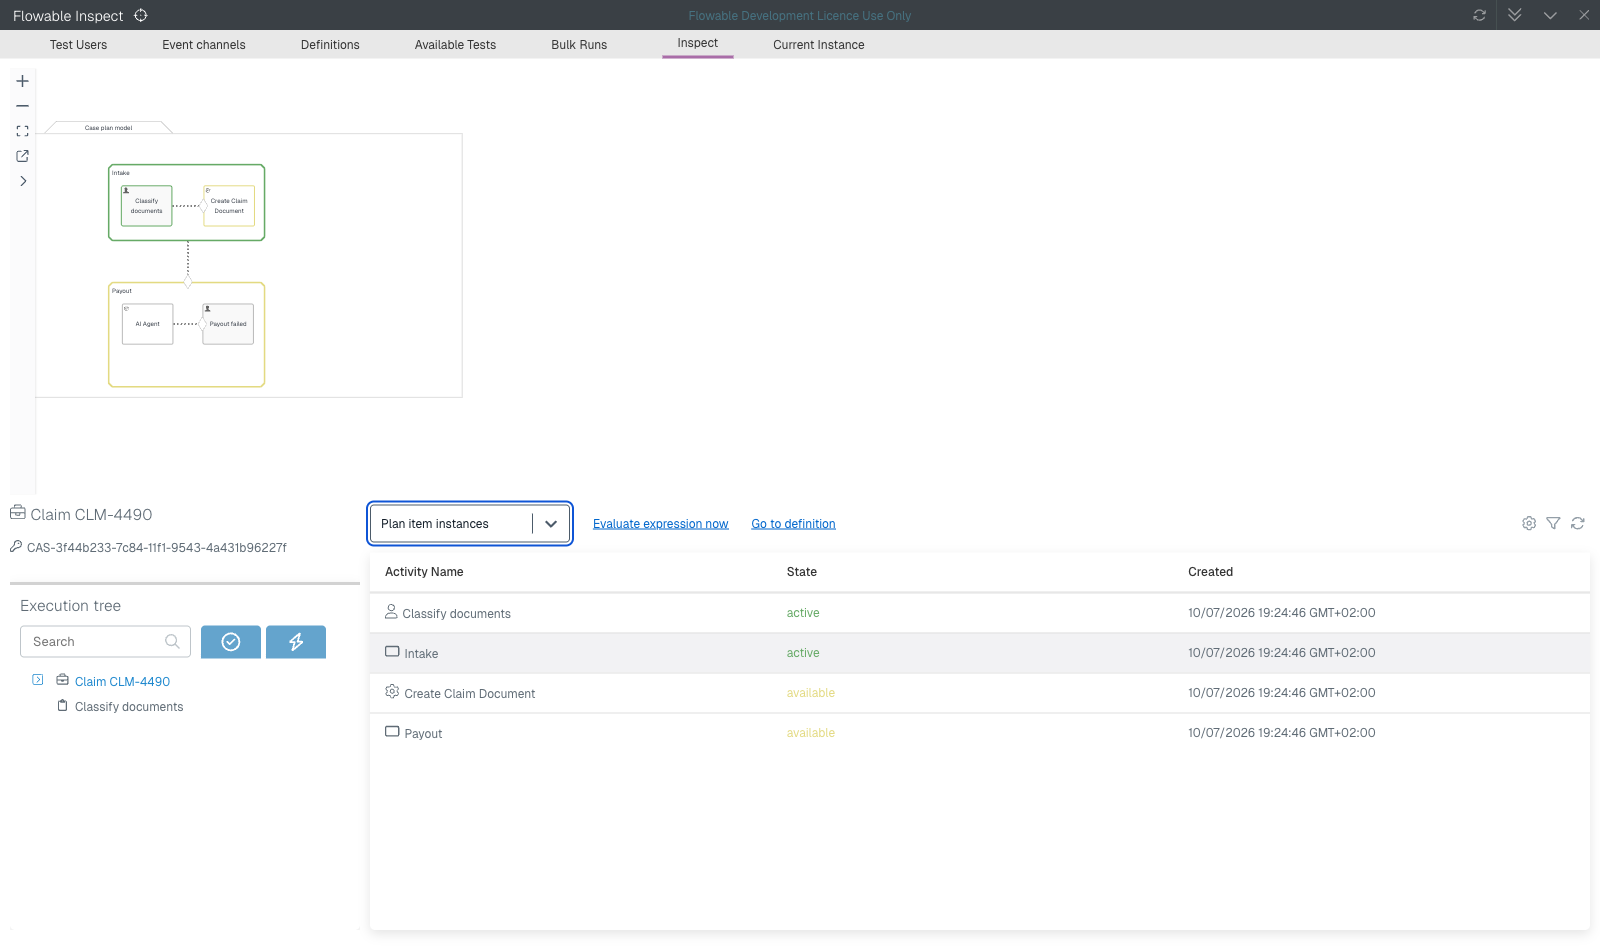
With the plan item list you can have a full overview of all the plan item instances that are currently evaluated with every change that is made on a specific case instance.
Inspect evaluate expression
Another feature that is available as part of the debugging functionality of Flowable Inspect is the possibility to evaluate expressions. Expressions are an important part of the logic in case and process instances, and when writing more complex expressions it's not always easy to get them correct the first time. The evaluate expression now button provides an easy way to test expressions within the context of the current case and process instance.
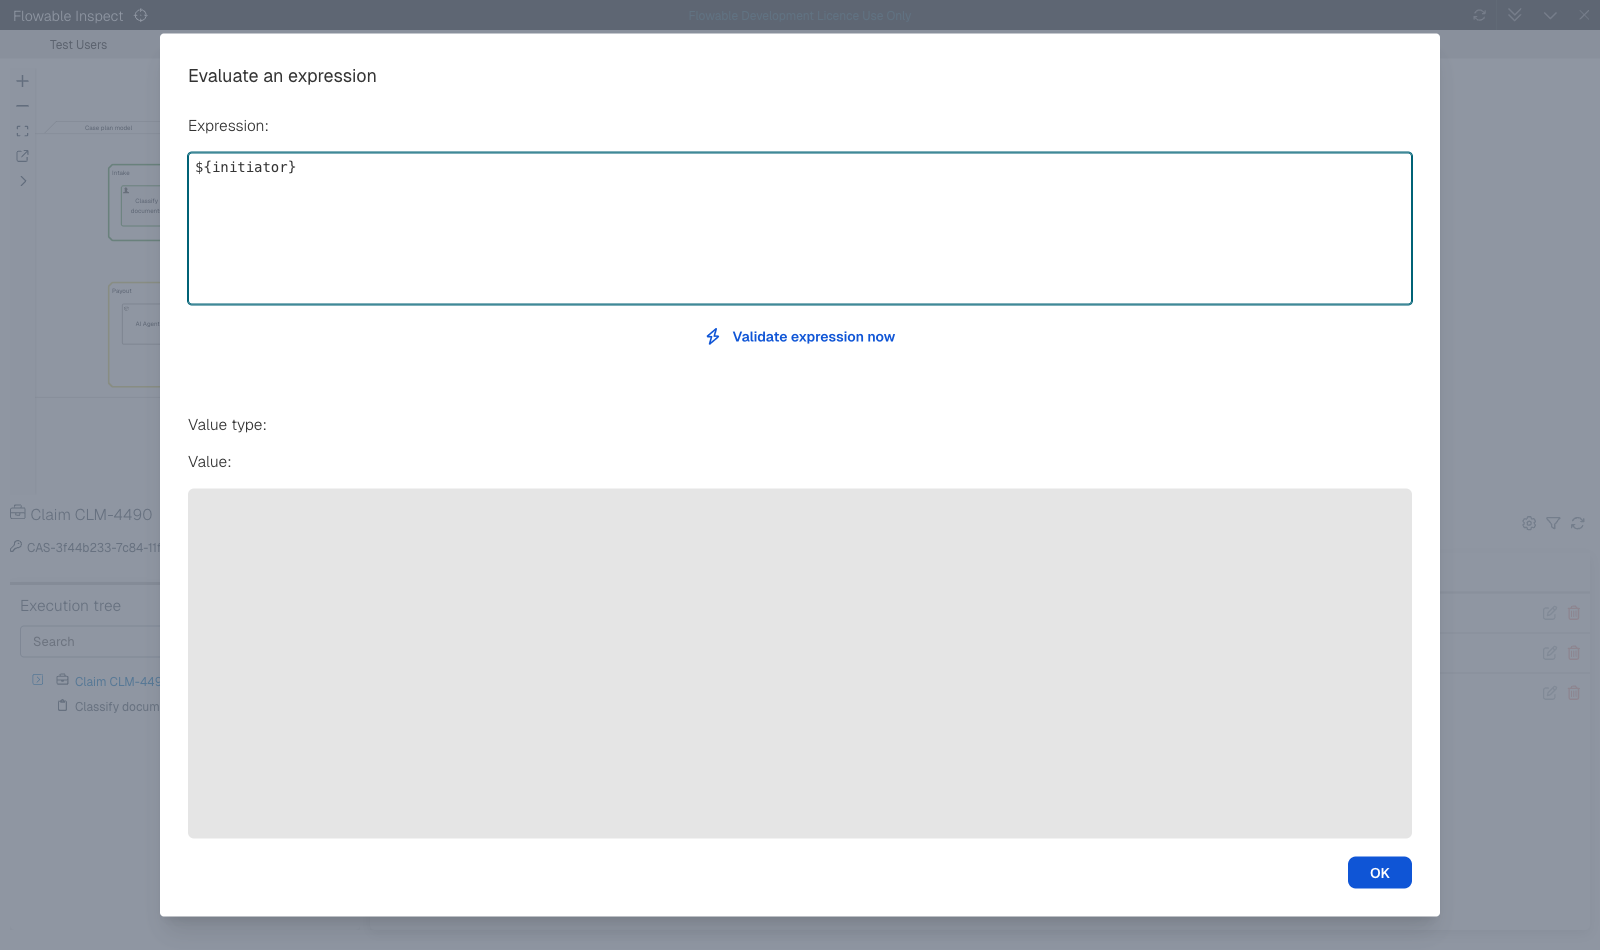
On clicking the Evaluate expression now link, a dialog is opened where an expression can be provided and then evaluated. In the following example a very basic expression is entered to return the result of the product variable.
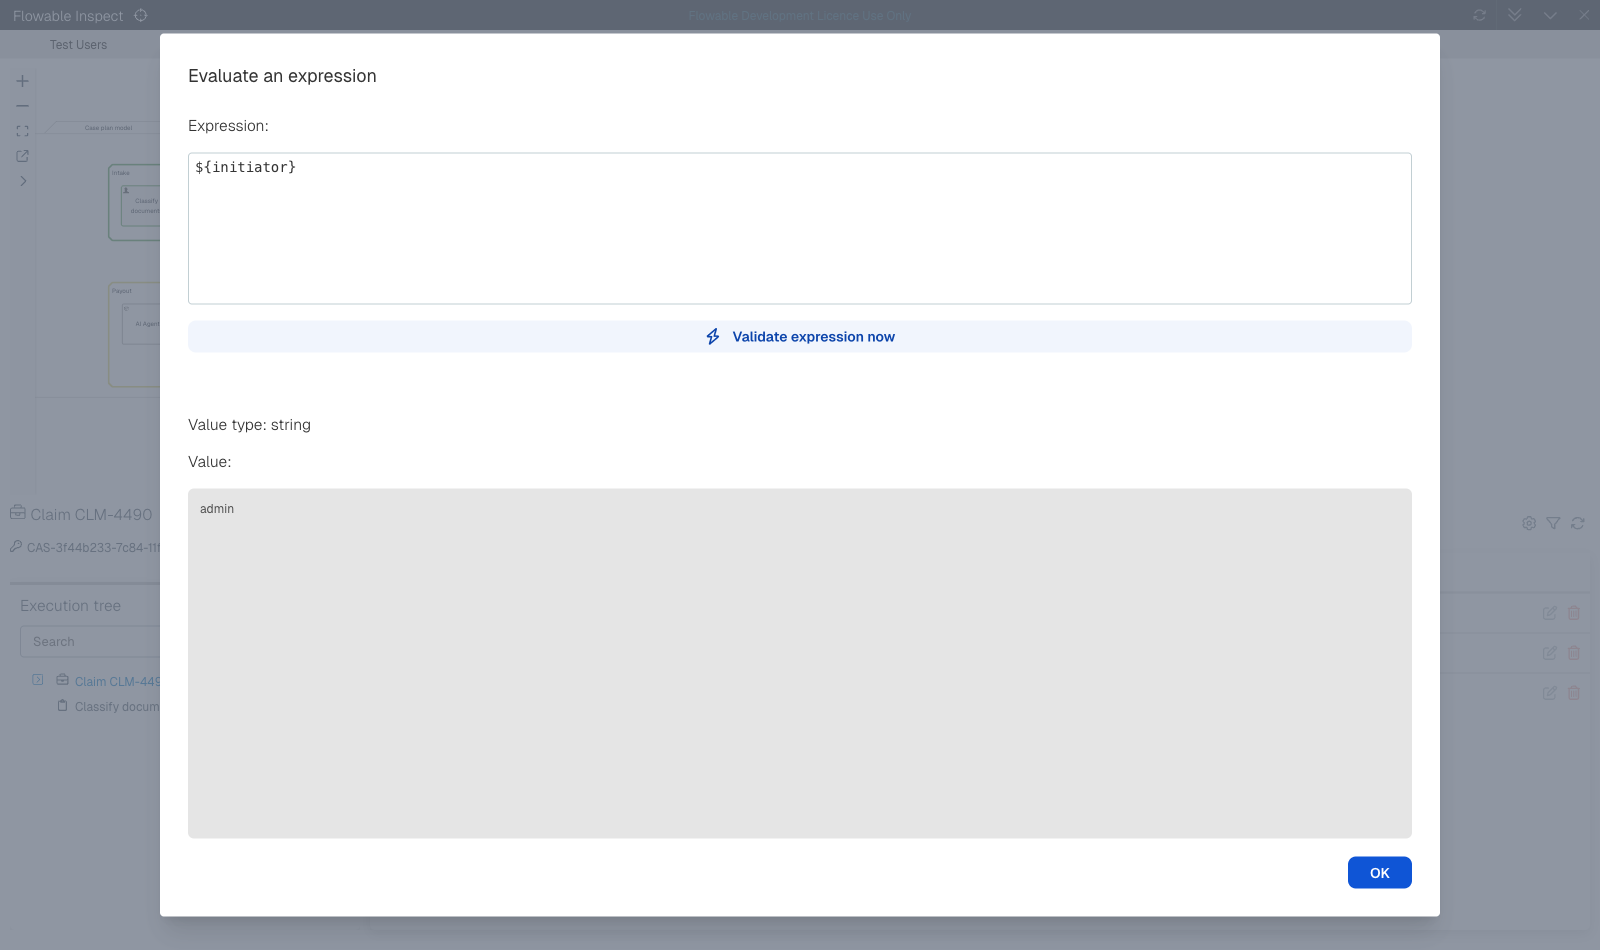
For sequence flow conditions and other expression types it's often useful to get a boolean result from the expression.
This is of course also possible using an expression like ${product == 'Laptop'}.
Inspect agent instances
2026.1.0+When a case, process or task instance invokes one or more AI agents, Flowable Inspect makes those agent runs available in the Agent instances section. This gives full visibility into what the AI agents did in the context of the instance you are debugging.
Selecting Agent instances from the dropdown lists the agent instances that ran within the current instance. For each one the table shows its Id, the Agent definition name, the agent definition Key and the Start time.
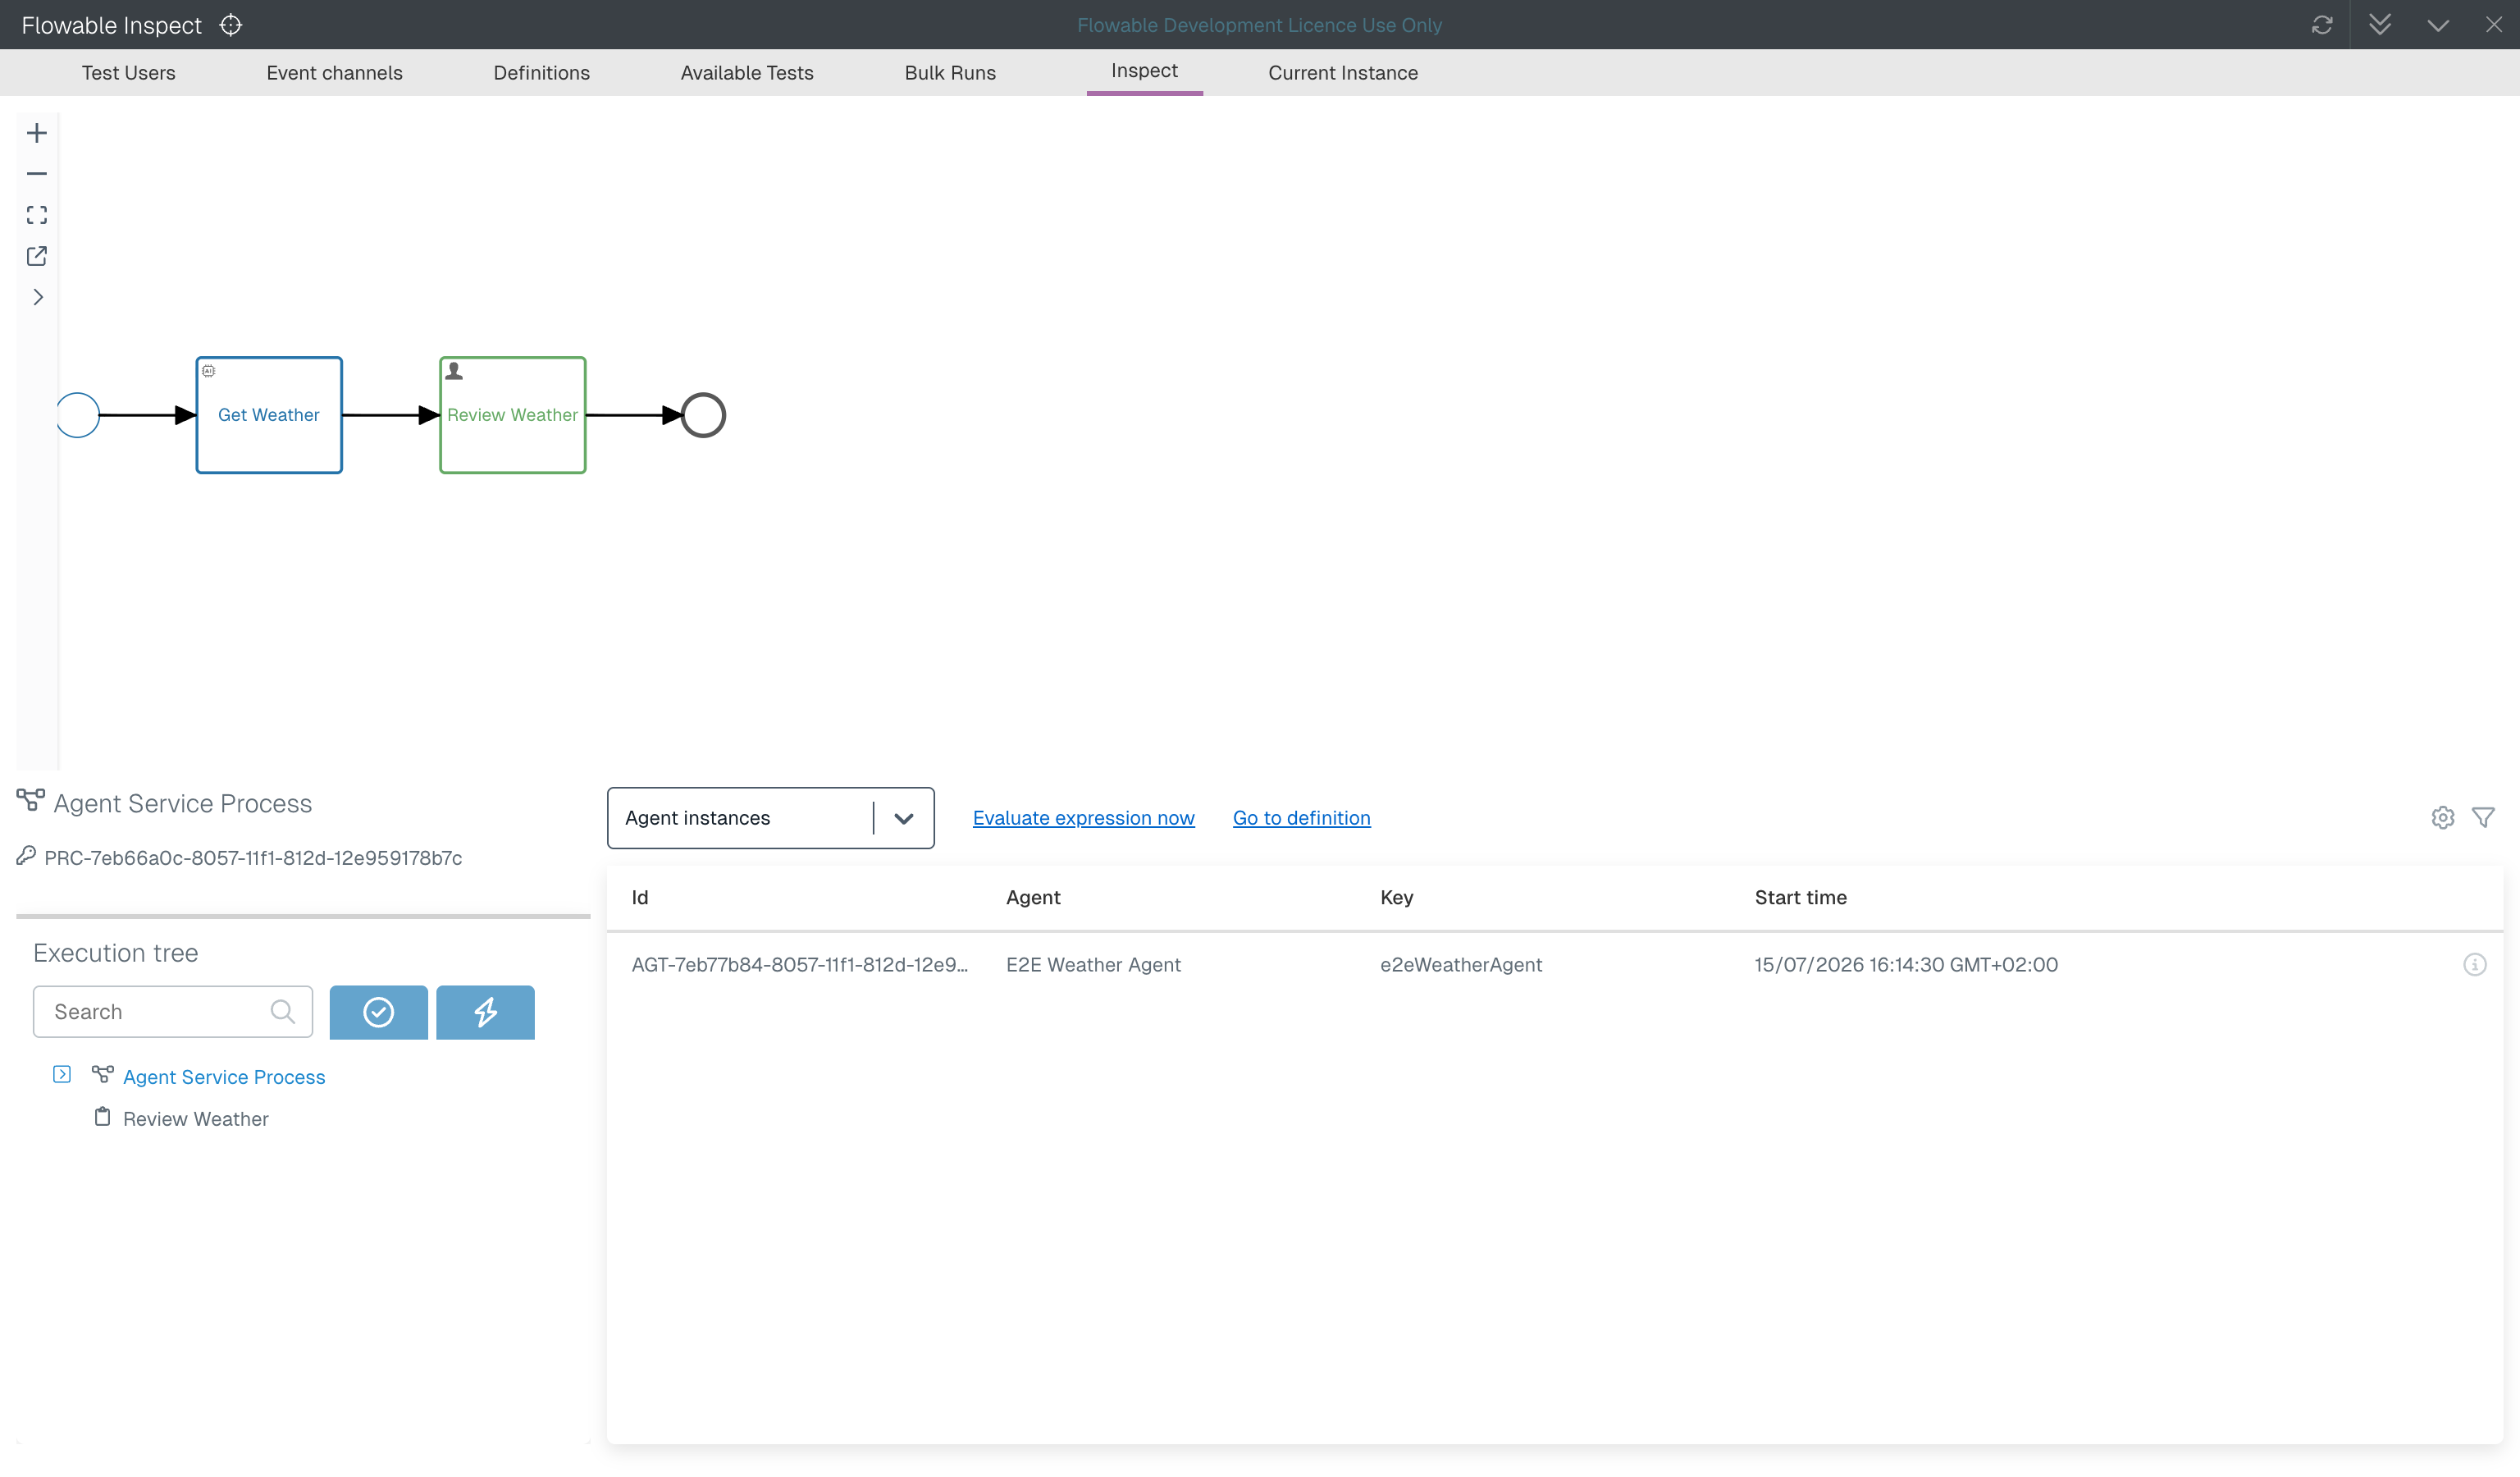
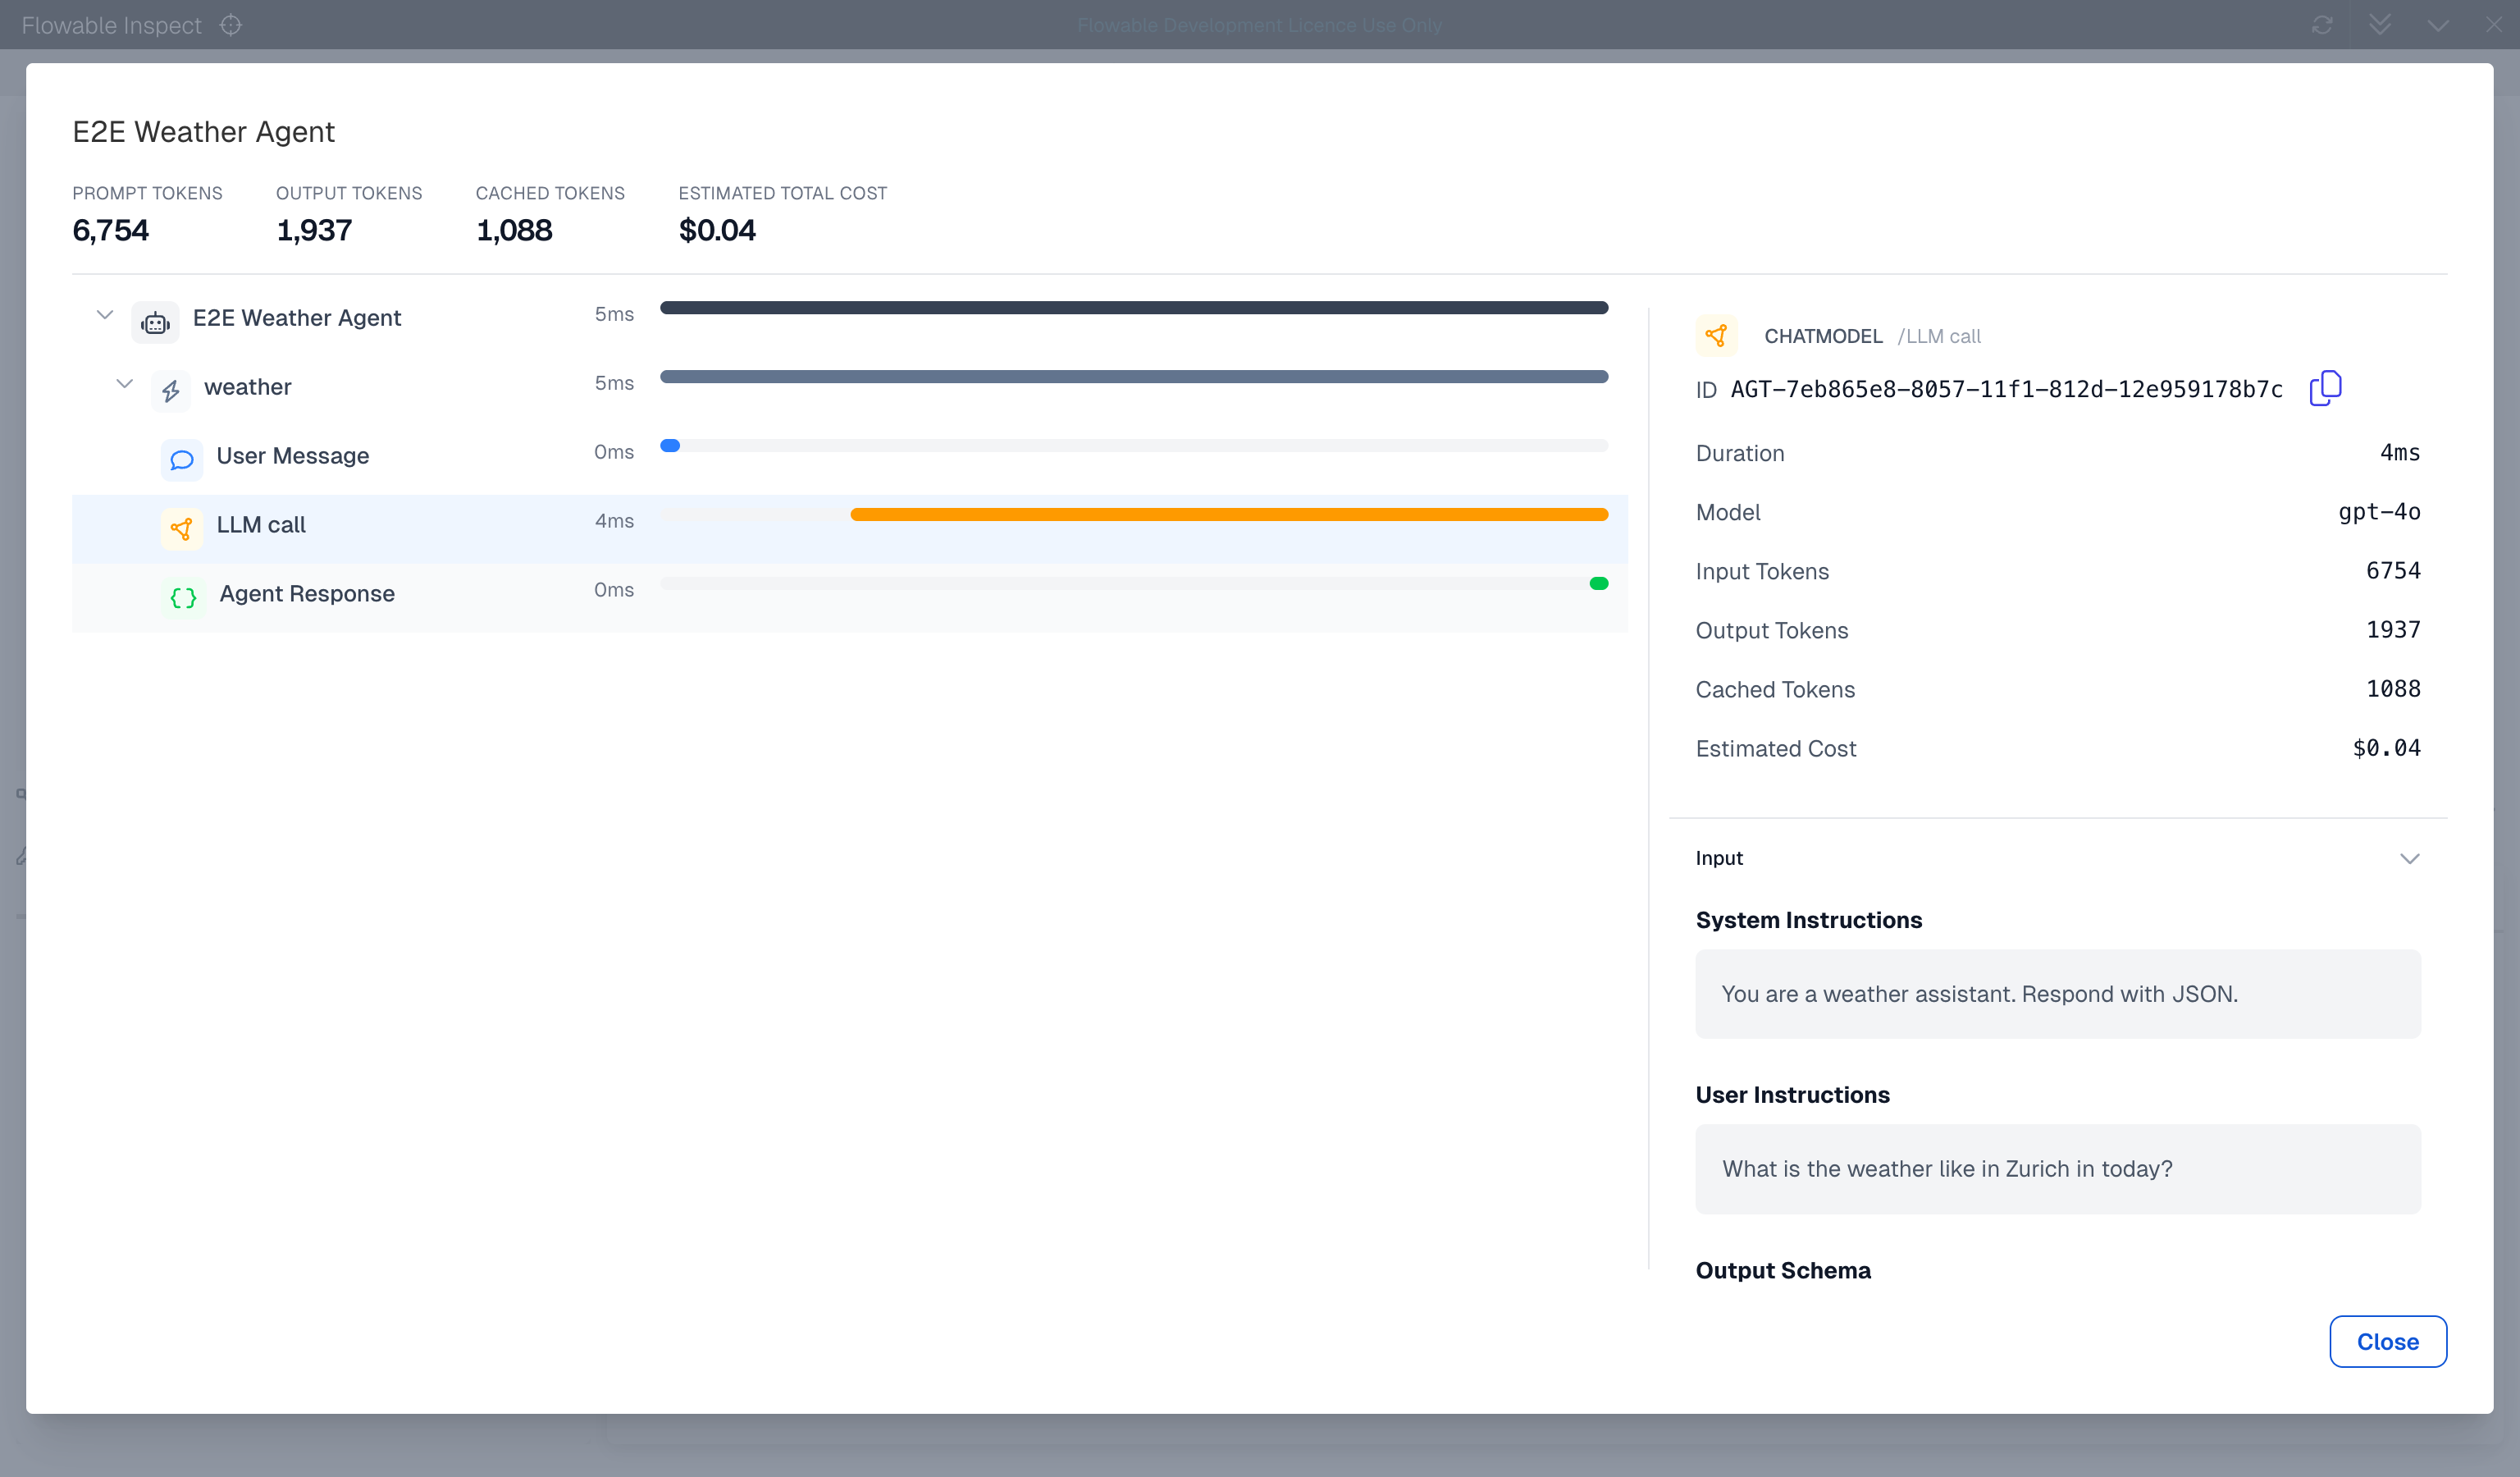
To dig into a specific agent instance, select its row and click the info icon on the right. This opens a detail view with a timeline of everything the agent did. Along the top, a summary shows the total prompt, output and cached token counts and the estimated total cost. On the left, the timeline lists the agent's invocations (one per operation the agent was asked to perform) and, nested under each, the individual exchanges — the user message, the LLM call and the agent response — with a bar indicating how long each step took. On the right, the properties of the selected timeline node are shown; selecting the root node displays the agent instance details, such as the agent definition, the start user and the case or process scope it ran in.
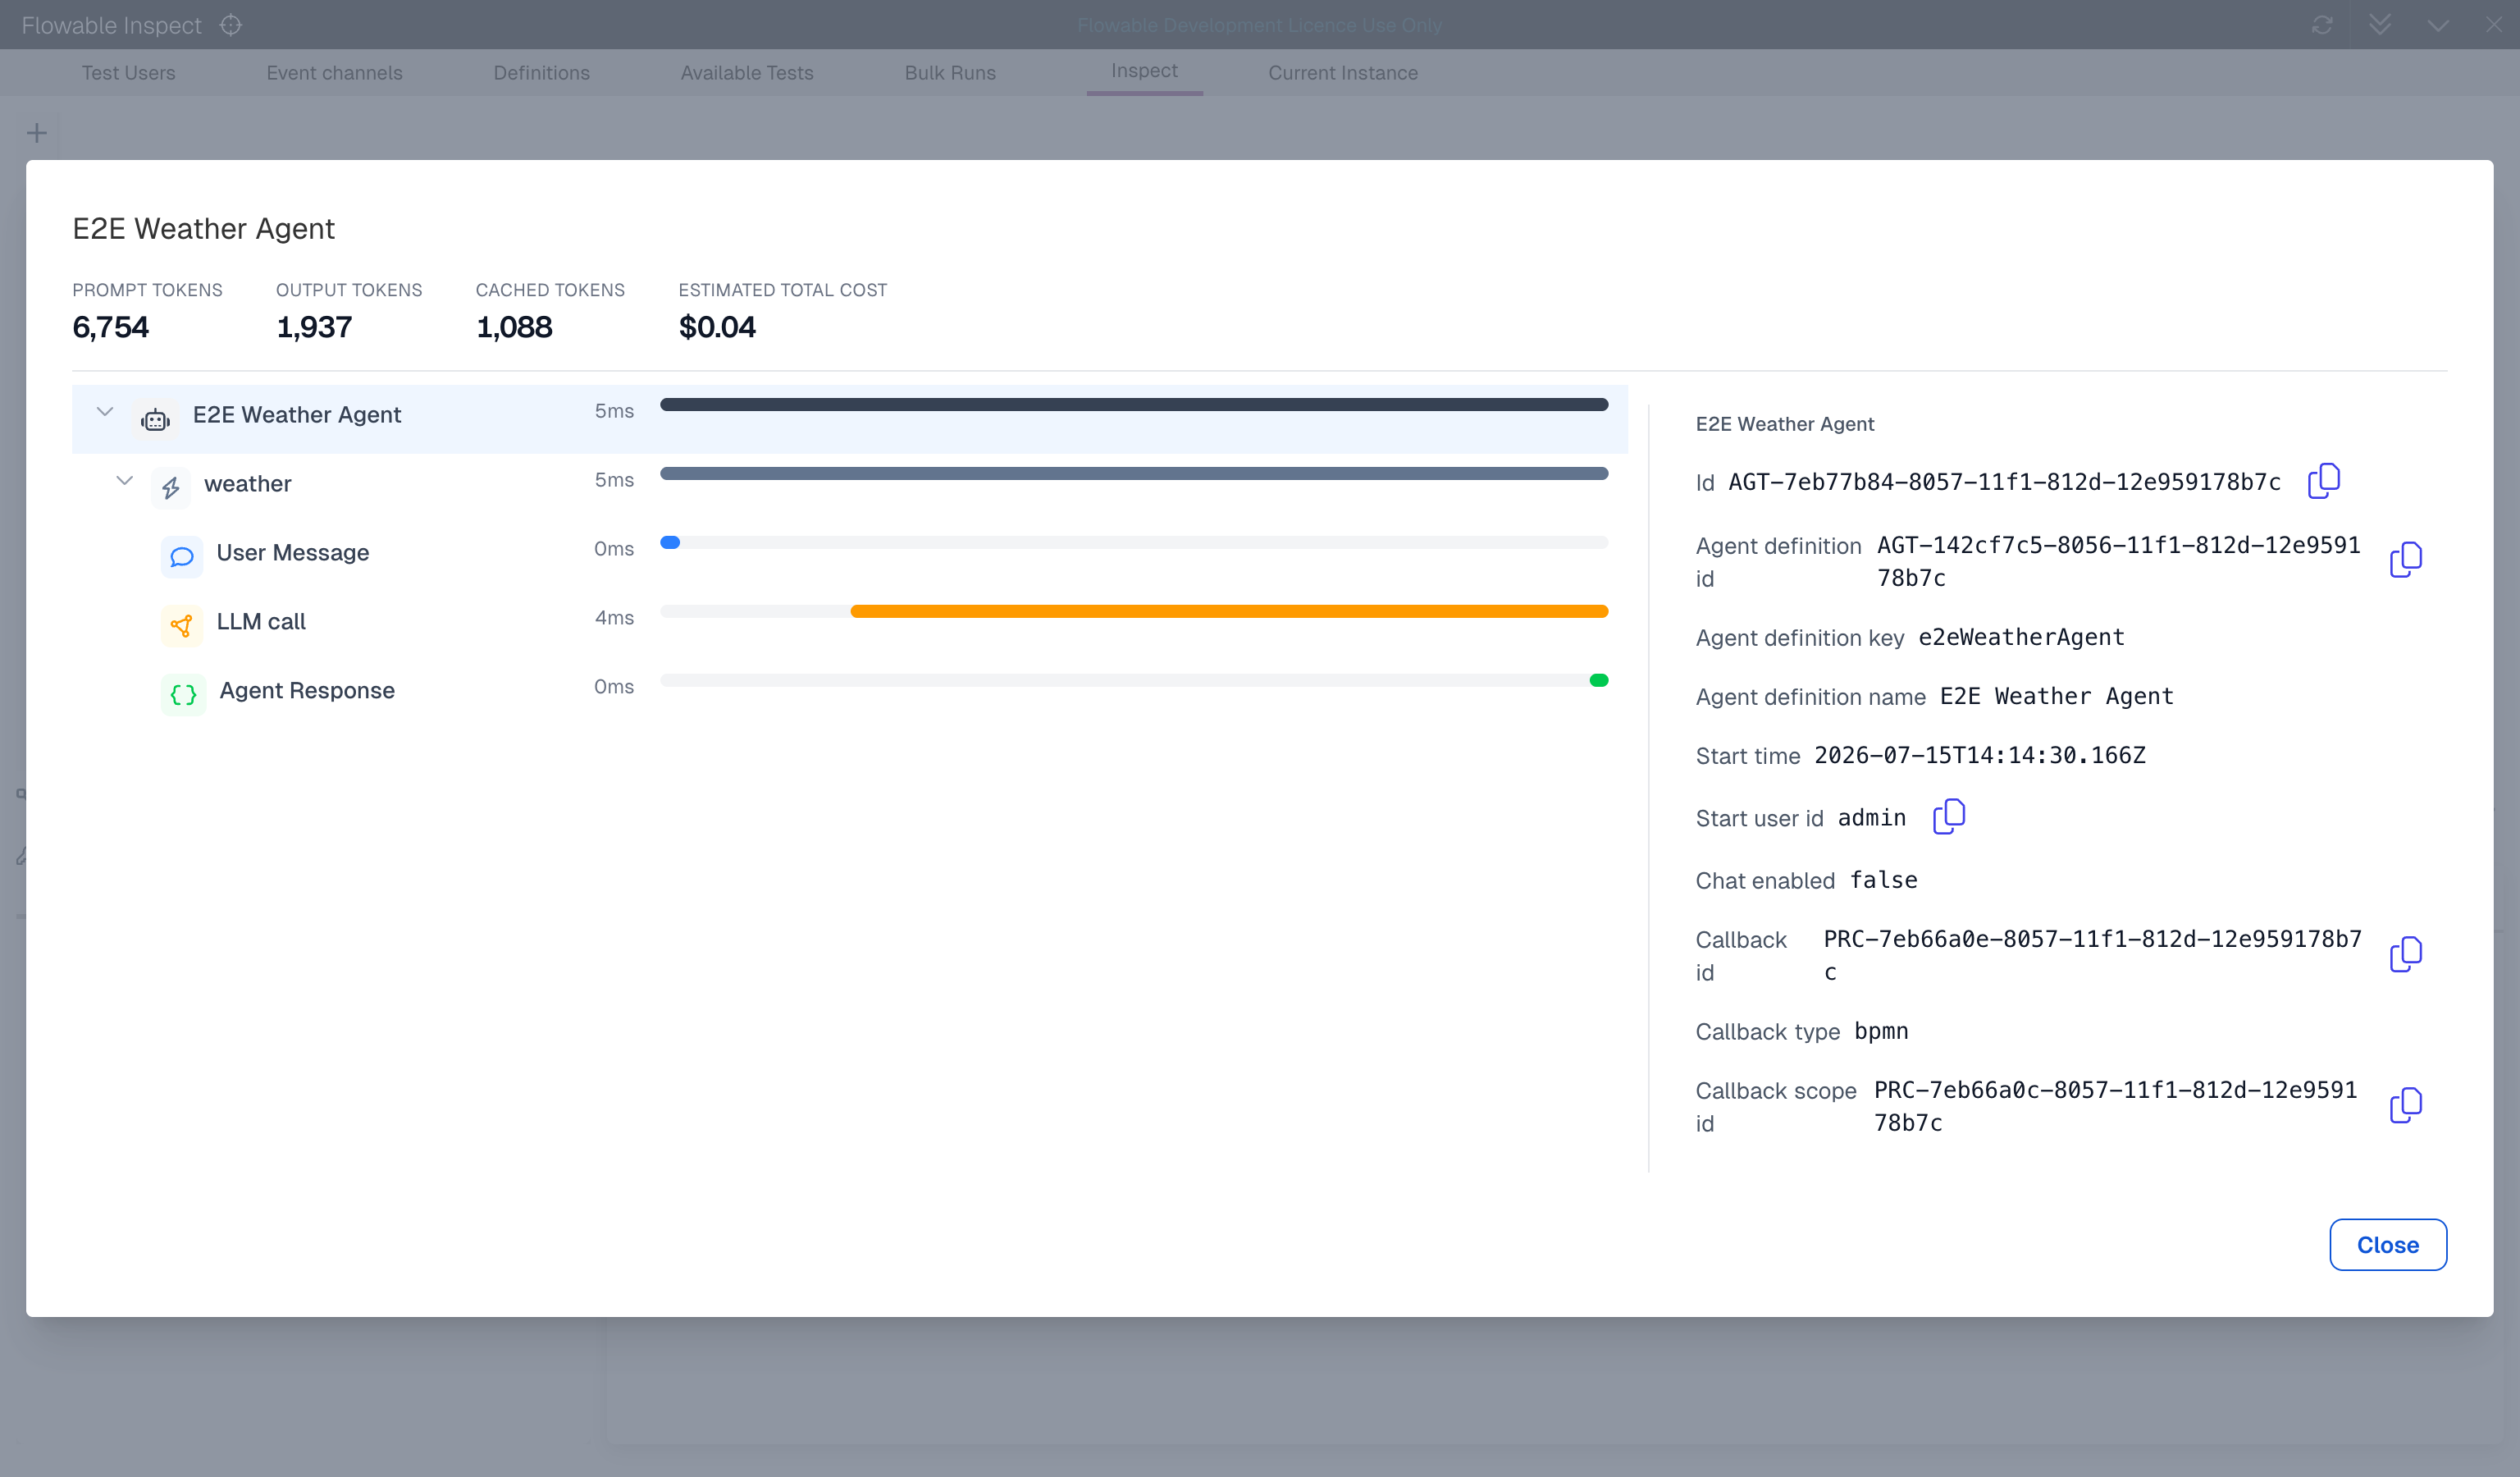
Selecting an individual exchange in the timeline shows its full detail. For an LLM call this includes the model that was used, the call duration, the input, output and cached token counts and the estimated cost for that exchange, together with the actual content that was exchanged, such as the system and user instructions that were sent and the response that was returned. From these per-exchange token counts an estimated cost is calculated per model, so you can see, for a specific instance, exactly which LLM calls an agent made, how many tokens they used and what they cost.
Inspect form debugger console
In Flowable Work it has always been possible to enable the Flowable Form debugger console via the developer tools of the browser. Now it's automatically available in the Current form tab when a task or work form is active in the Flowable Work UI.
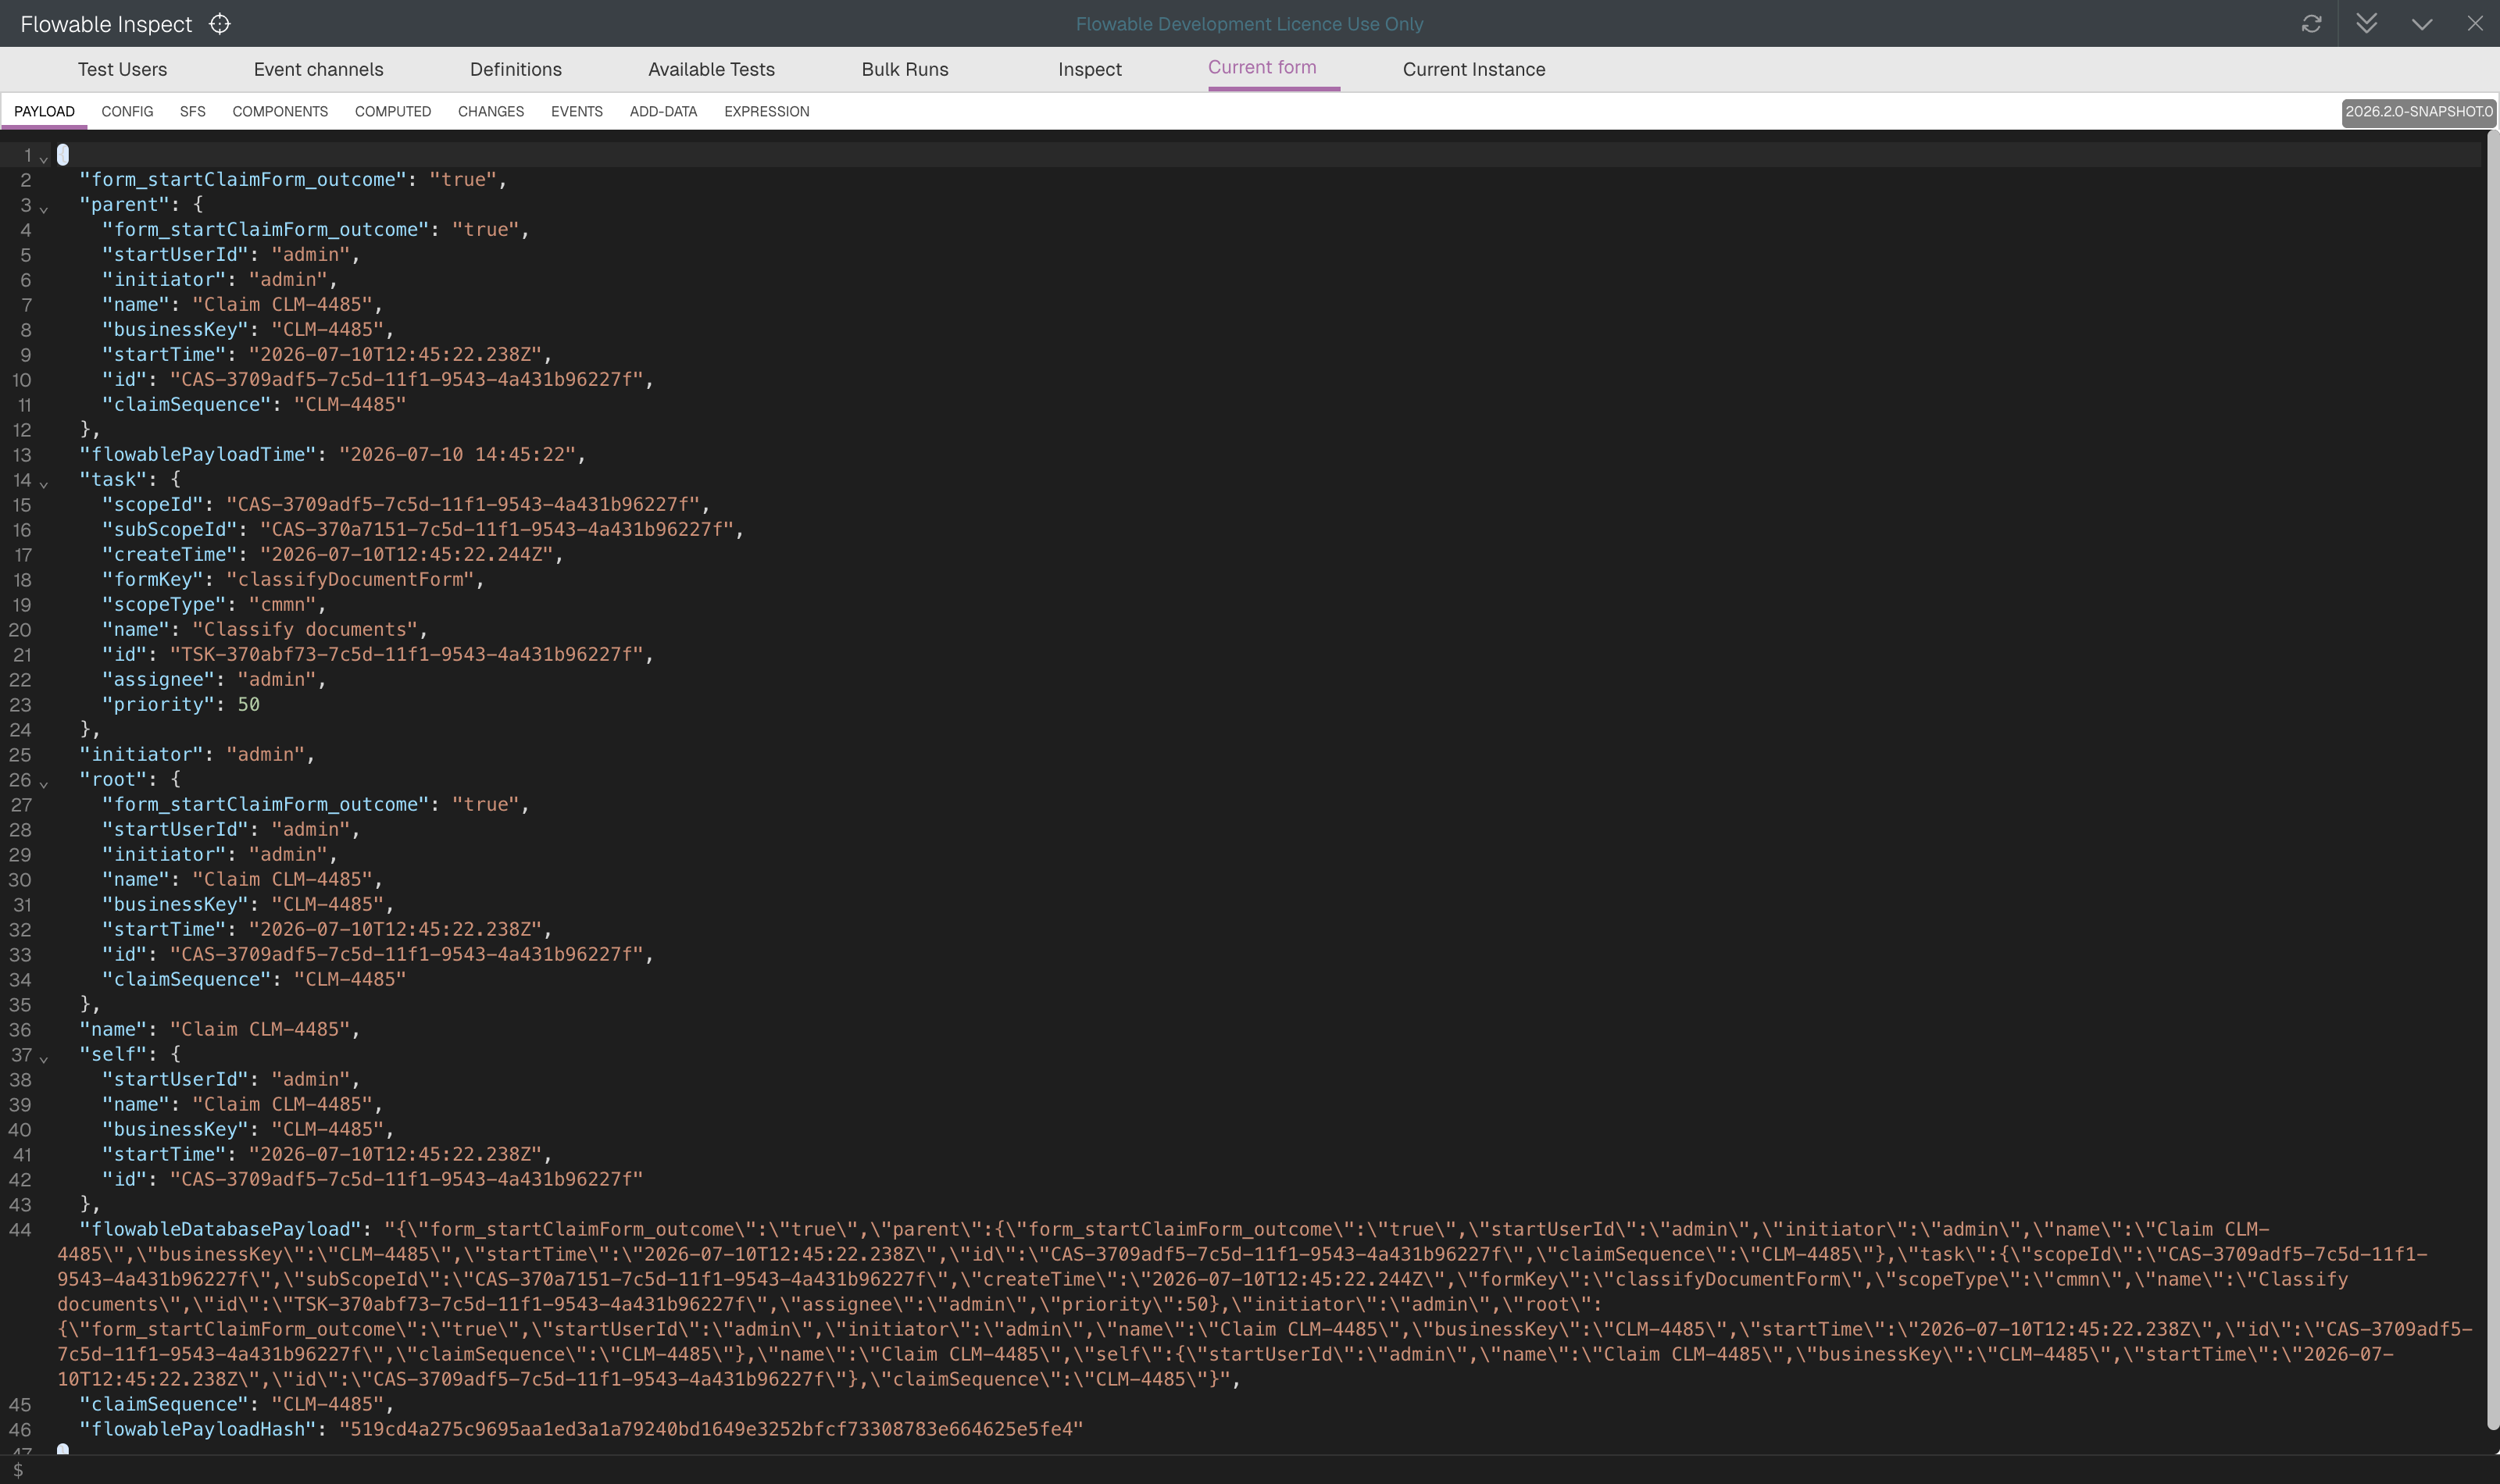
In the Form debugger console the form payload can be modified and any changes are reflected in the form immediately. The payload is shown in a CodeMirror editor with syntax highlighting, and a breadcrumb helps you navigate the JSON structure of larger payloads. The form definition itself can also be changed directly in the console, and an expression evaluator lets you evaluate an expression against the current form payload, so you can check its result while you work on the form.
Testing models with Flowable Inspect
In addition to debugging case and process instances, Flowable Inspect also provides functionality to create test models that can be executed again at any point to make sure that the case or process instance still executes as expected. A test model gets created automatically while completing task forms, execution action buttons and other interactions through the Flowable Work UI. The current state of a test model is always available in the Current test tab in the Inspect view. In this section we will have a closer look at creating a test model and other features that are part of test models with Flowable Inspect.
Create a test model
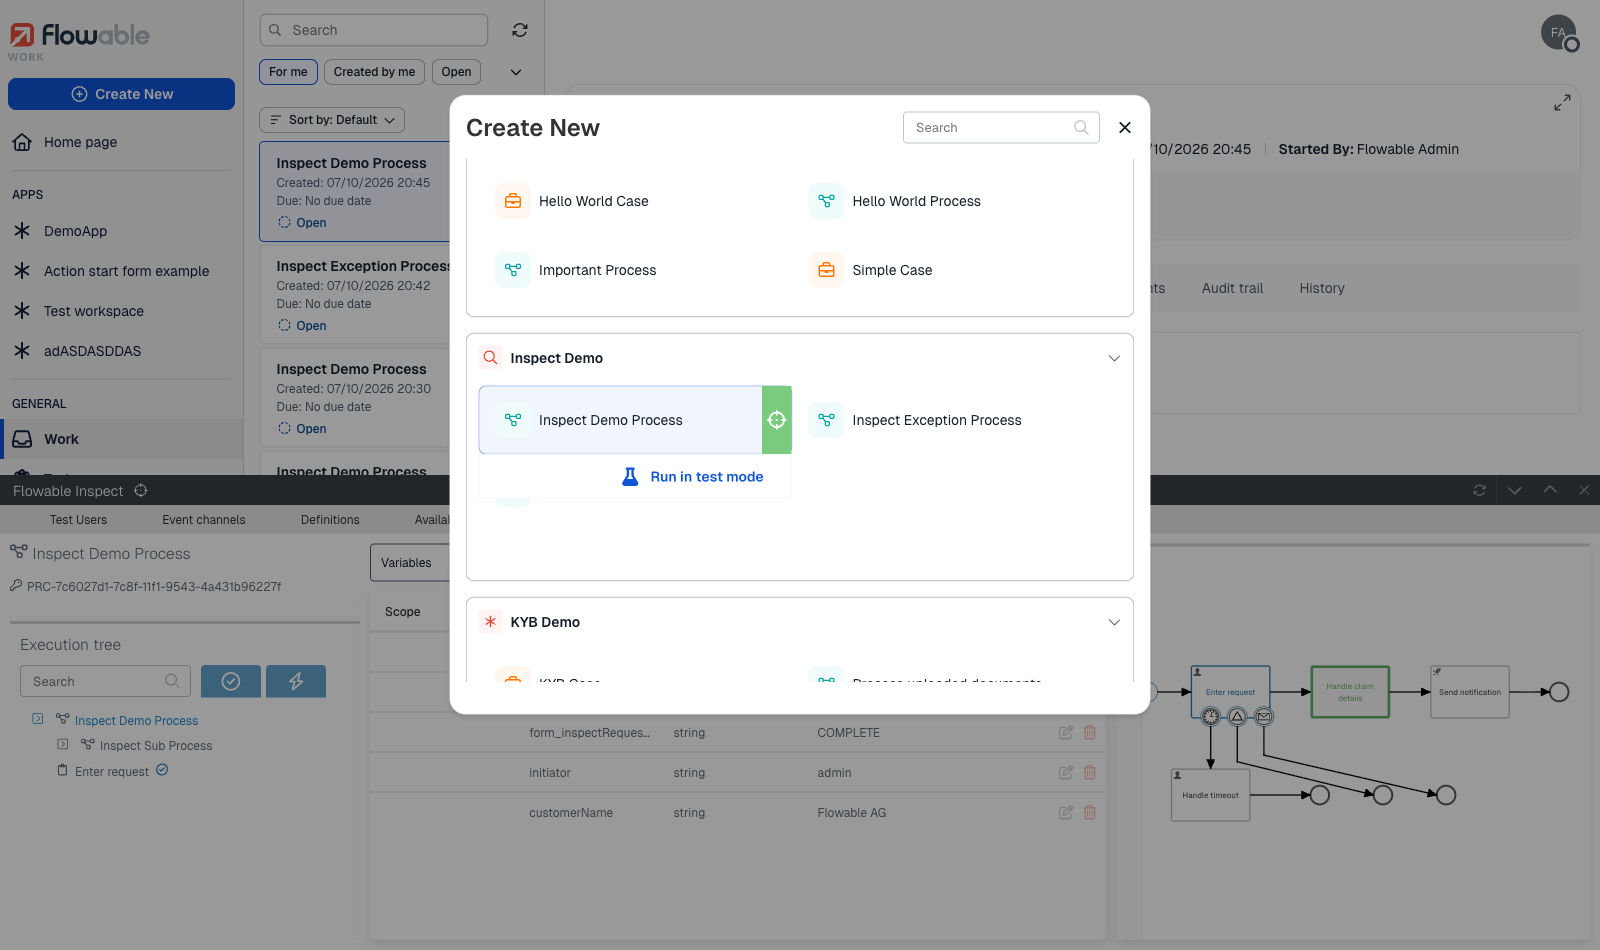
To create a test model for a CMMN or BPMN model, there is a specific way to start a new instance. It's important to have the Inspect view open before going further. When the Inspect view is open, the create instance dialog has a new option available. When hovering over the CMMN or BPMN model that you want to start, a green "target" icon appears. In the following example, a test model for the Inspect Demo Process will be started when the green "target" icon is selected, followed by clicking the Run in test mode button that appears.
If a start form is defined for the CMMN or BPMN model for which a new instance is started, then this will be shown next. Data filled in the start form will be automatically recorded as part of the test model. When the start form is submitted, the newly created case or process instance will automatically pause on the plan model for a CMMN model and on the start event for a BPMN model. This is done to ensure that, even for a straight-through case or process, you can test values, set breakpoints and so on. In the next example, the Inspect Demo Process has been started and the start form has been submitted. Now the process instance is waiting at the start event, before any activities are executed.
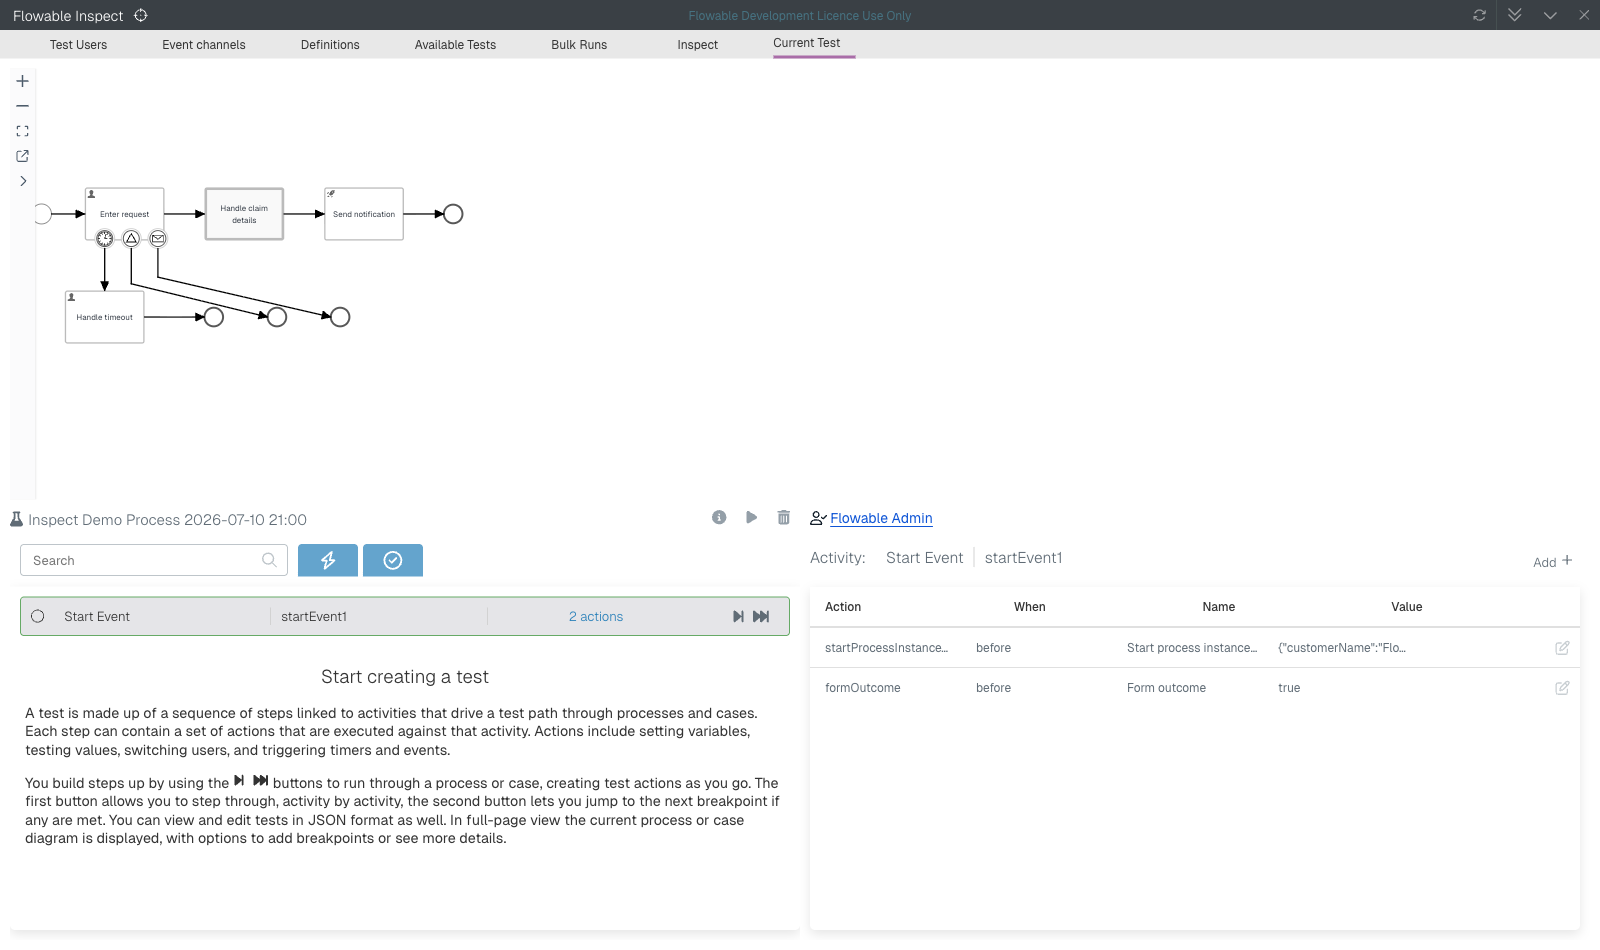
On the left side of the Current Test tab, the steps of the case or process instance are shown. In this example, the process instance has only one step, which is the start event. From this wait state we can now continue to the next step with button 1 (Step to next activity), shown in the screenshot below. In this way you will step through every activity of the process instance and wait at every point, in the same way as you might be used to do debugging code in your favourite IDE. With button 2 (Fast forward to next breakpoint) the process instance will continue in the normal execution way until the transaction is fully completed or the next breakpoint is reached.
On the right side of the screenshot, you can see the actions of the step selected. In this example, the recorded start form data is the first action (Start process instance with form). When you click on the edit button the payload of the submitted form is shown, like this:
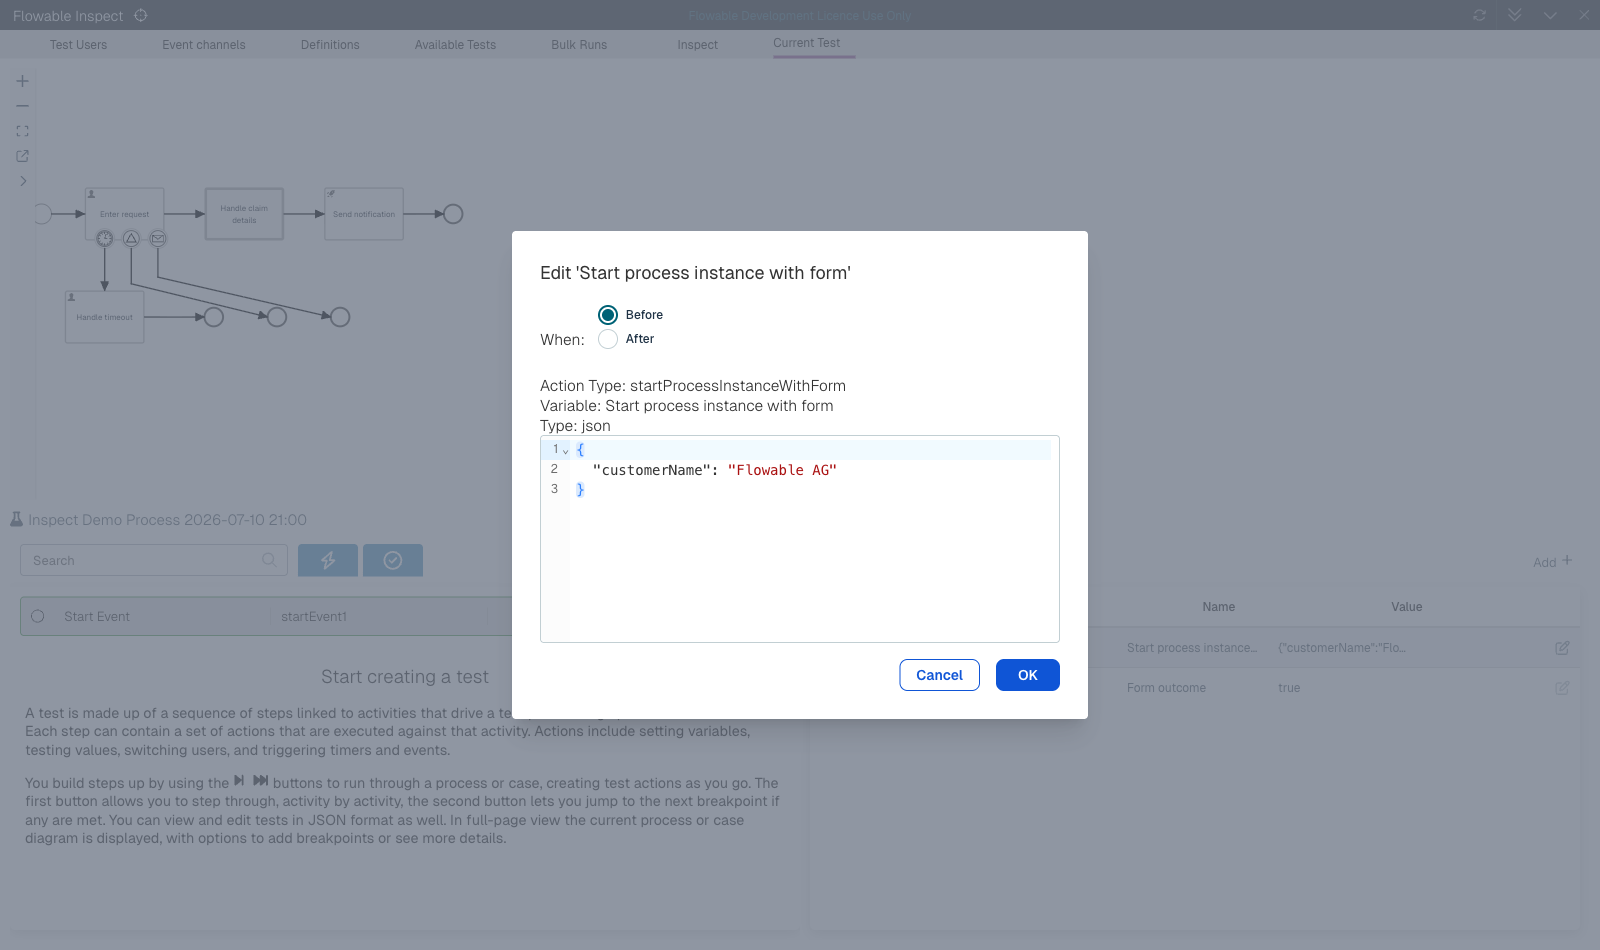
After clicking button 2 to continue the next full transaction, the Enter request user task becomes active. When the human task form is filled in and completed using the Flowable Work UI, this action is recorded automatically again as part of the test model. The test model state after completing the first human task is shown in the next screenshot.
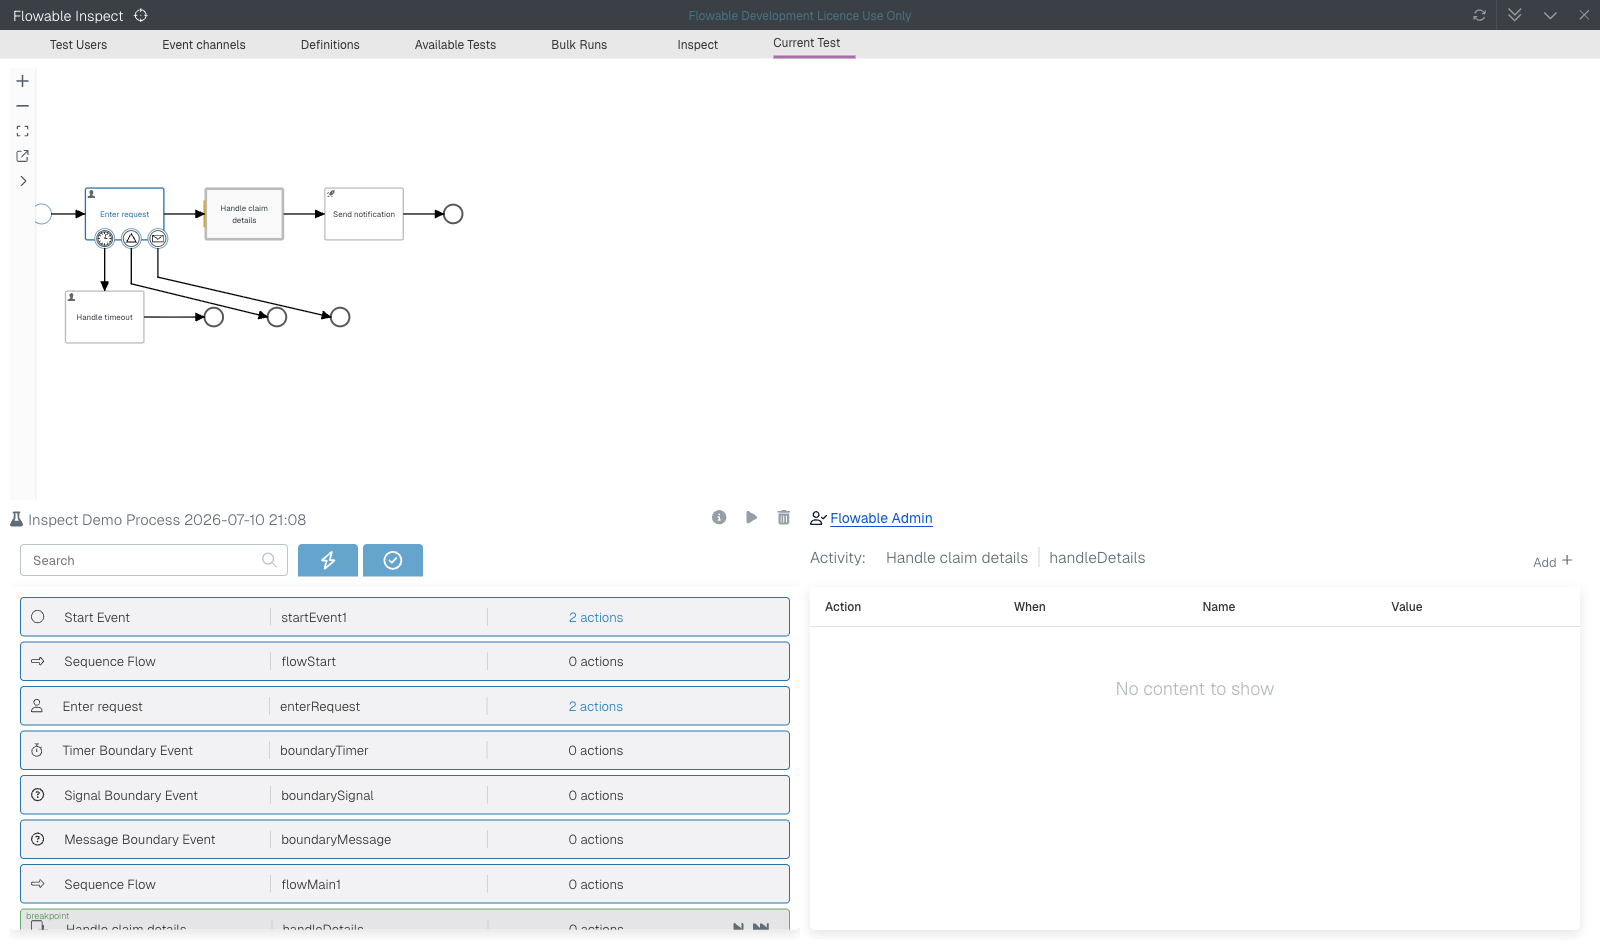
The Enter request user task is visible and is highlighted in blue. This means that this step is in the completed state. The steps that follow show the activities that will be executed next as you continue stepping through the process. For a CMMN case, plan item instances that are enabled but not yet active are shown in yellow, so you can see which steps can still be manually activated.
The current selected step is the completed Enter request task, so on the right side you can see that two actions have been registered: the submitted task form payload and the chosen form outcome. In addition to the actions that are automatically created while starting an instance and submitting a start form, and completing a task form, it's also possible to add test actions on a step manually. By clicking the Add button on a step, we can see in the following example that three actions are available to be added.
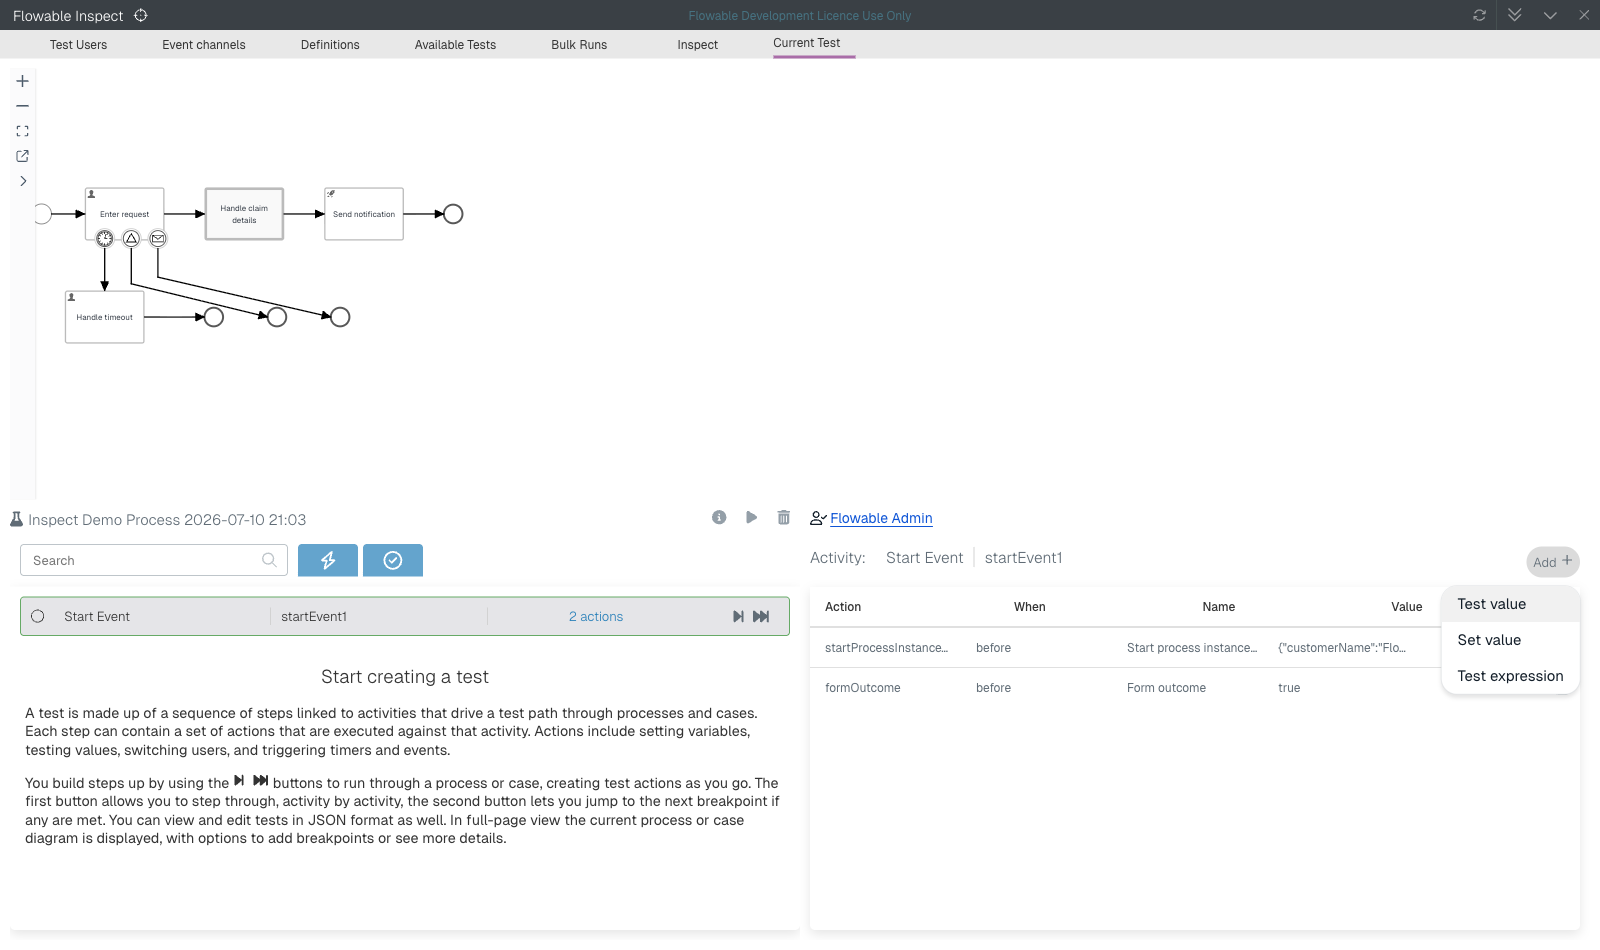
One action is to set a variable value. This can be for setting a new value for an existing variable, or adding a completely new variable with a value.
The action will set the value on the current instance scope immediately. Another action is to test a value, where you can test if a variable value is as expected at this step of the case or process.
This is an important part of testing models, because variables often determine the path and the sequence of the steps through a case or process model. And by testing if a variable
has a specific value at a specific step in the case or process instance, a significant part of the model validation can be defined.
The final option is to test an expression, which is very similar to testing a value. When testing an expression, more options are available to test variable values or some other property of the current instance with a JUEL expression, such as ${customerName == 'Flowable using'}. The result of this expression needs to be a boolean value equal to true.
When we complete the case or process instance by completing any remaining task and adding actions where appropriate, the test model will be completed as well. Any fully or partially completed test models are listed in the Available Tests tab.
Working with breakpoints
Above, we already encountered breakpoints while creating the test model. When starting a new case or process instance with the test mode enabled, an initial breakpoint is created that defines a first wait state immediately after starting the case or process instance. In technical terms, the case or process instance is in a wait state and a suspended job is created. When stepping through the case or process instance new breakpoints are created on every step. But the focus of what we're covering here is how to manually define breakpoints.
A breakpoint can be added before and after an activity of a case or process model. In this way, you can inspect the state of the running case or process instance before the activity is executed or immediately after the activity has been executed. This is mainly useful for activities that otherwise would have been executed automatically, such as a service task, decision task or HTTP task and so on. When adding a breakpoint after a service task, it's possible to inspect the variables that have been set by the service task or add a test value action to the test model, allowing you to explicitly test a variable value to validate the service task execution.
Let's now look into adding a breakpoint to automatic activities. Expand the diagram on the right side of the Current Test tab with the button at the top of the diagram menu that is shown on the left of the diagram. The diagram is shown in the top half of the view and its activities can now be clicked, just like buttons or links. When you click on an activity an action menu appears that provides navigation actions for call activities, case and process tasks, or shows forms and decision tables. It also provides options to add and remove breakpoints.
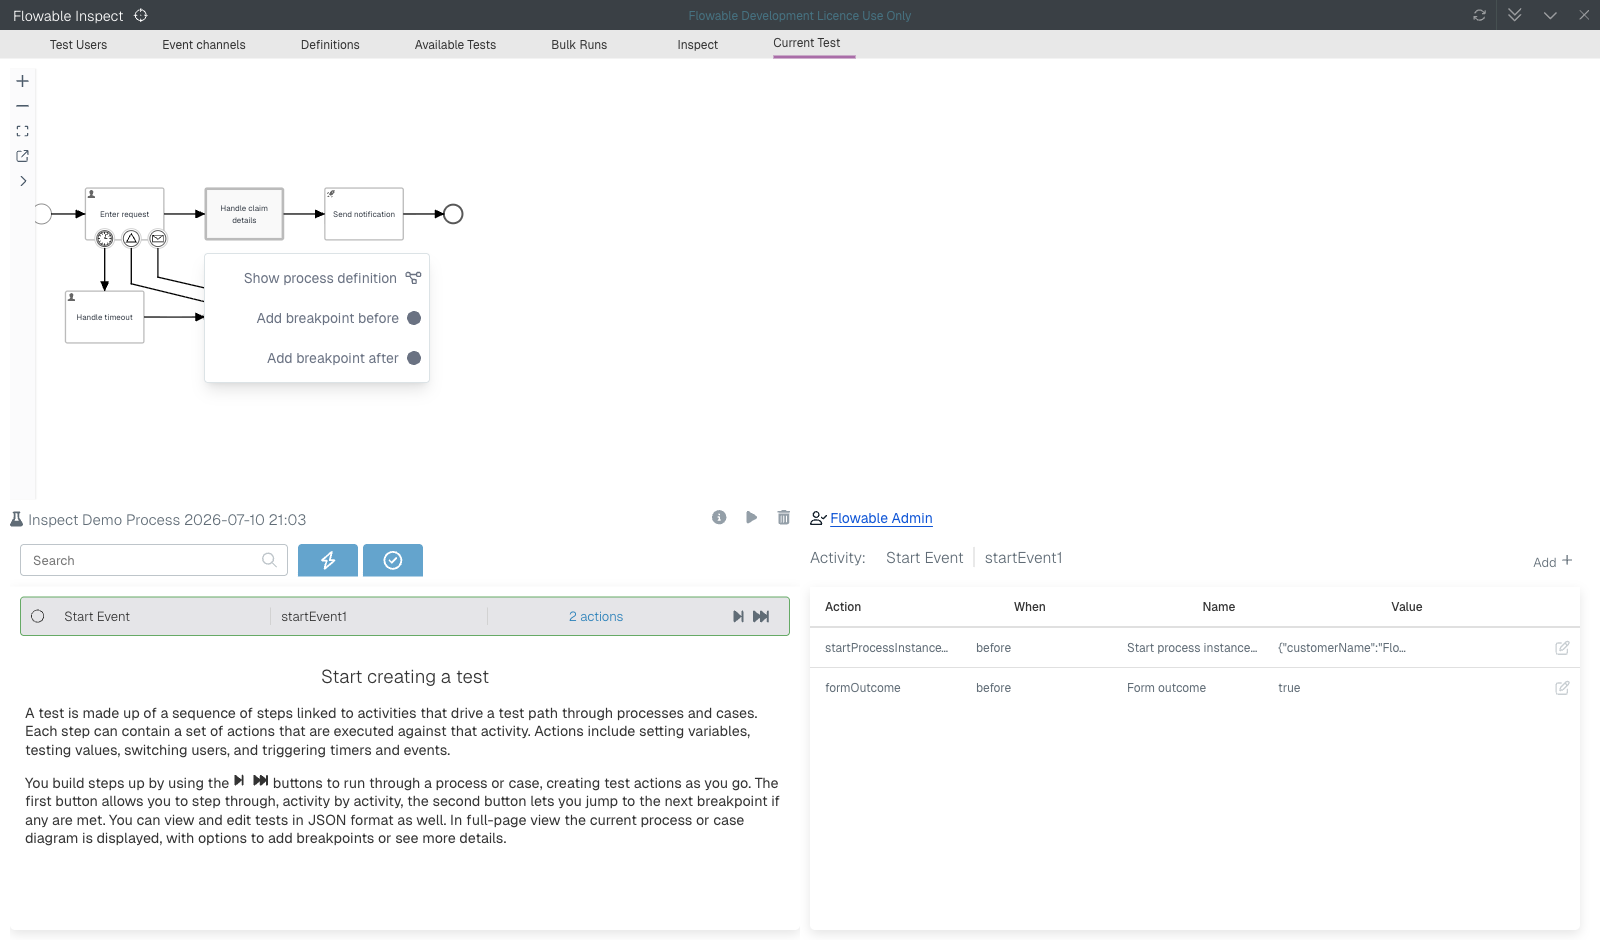
In this example, the action menu for the call activity element is shown, allowing you to navigate to the process diagram if you wish, and also to add a breakpoint before or after the activity executes. Let's add a breakpoint before the call activity, which means that the process will wait before the sub process instance will be started. In addition, let's add a breakpoint after the Send notification service task, so that right after the service task has run the process will wait and we can test for the expected outcome values. The diagram visually indicates a "before" breakpoint with a dark yellow vertical line on the left side of the element rectangle. The "after" breakpoint is similar but drawn on the right side of the element rectangle.
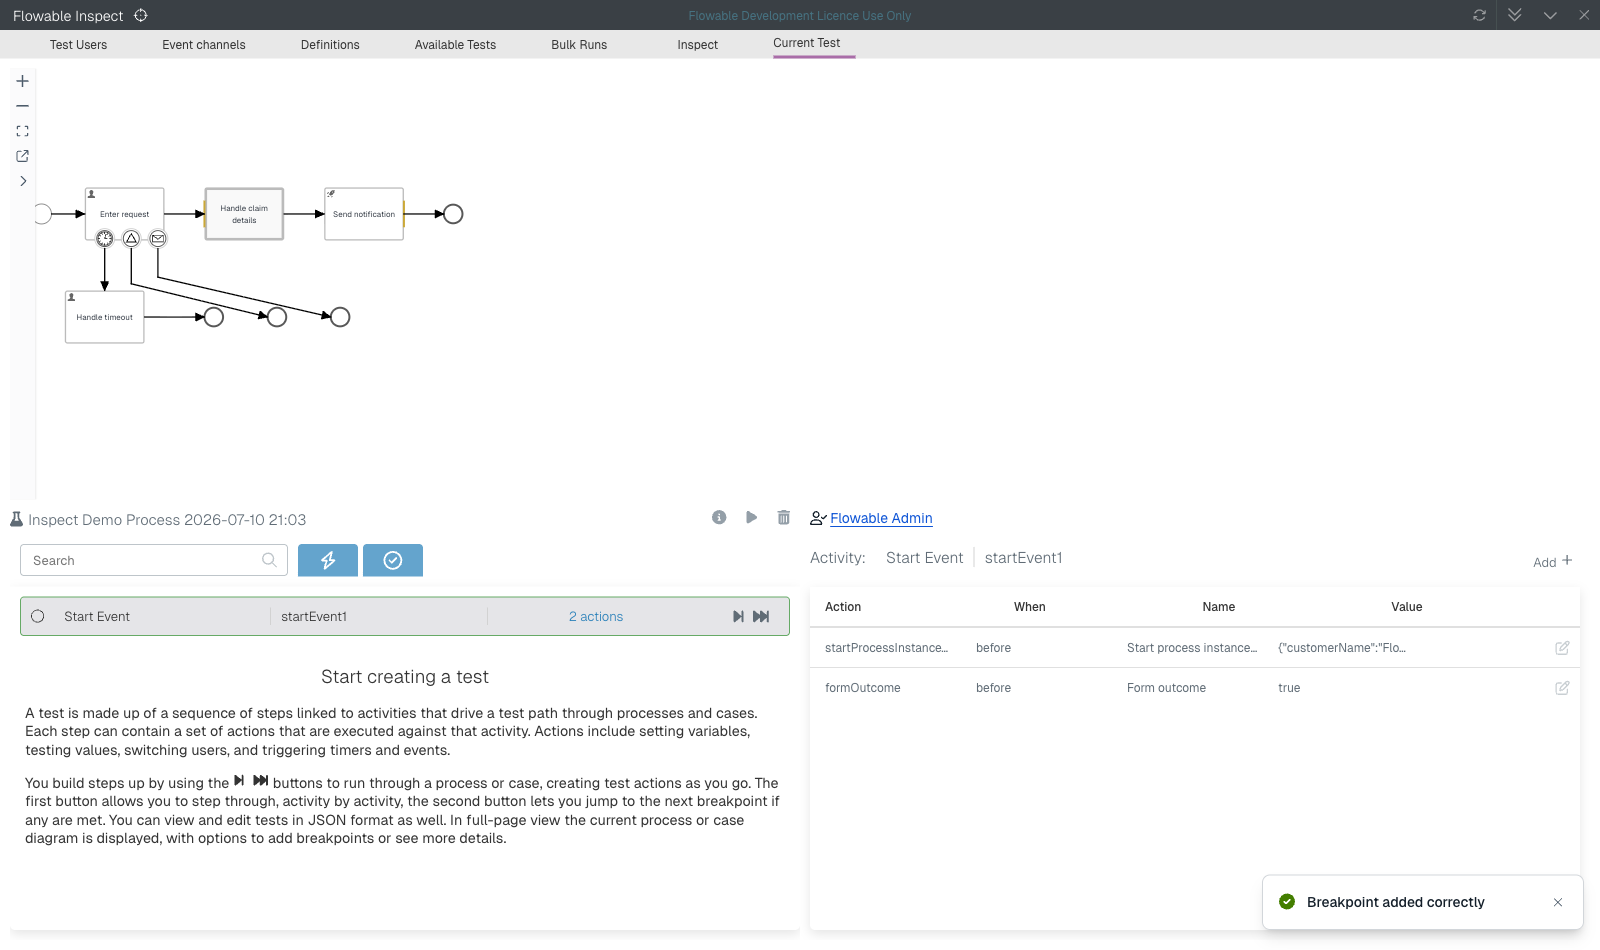
With these two breakpoints set, we can now complete the user task before the call activity, and the process execution will wait before the sub process instance is started.
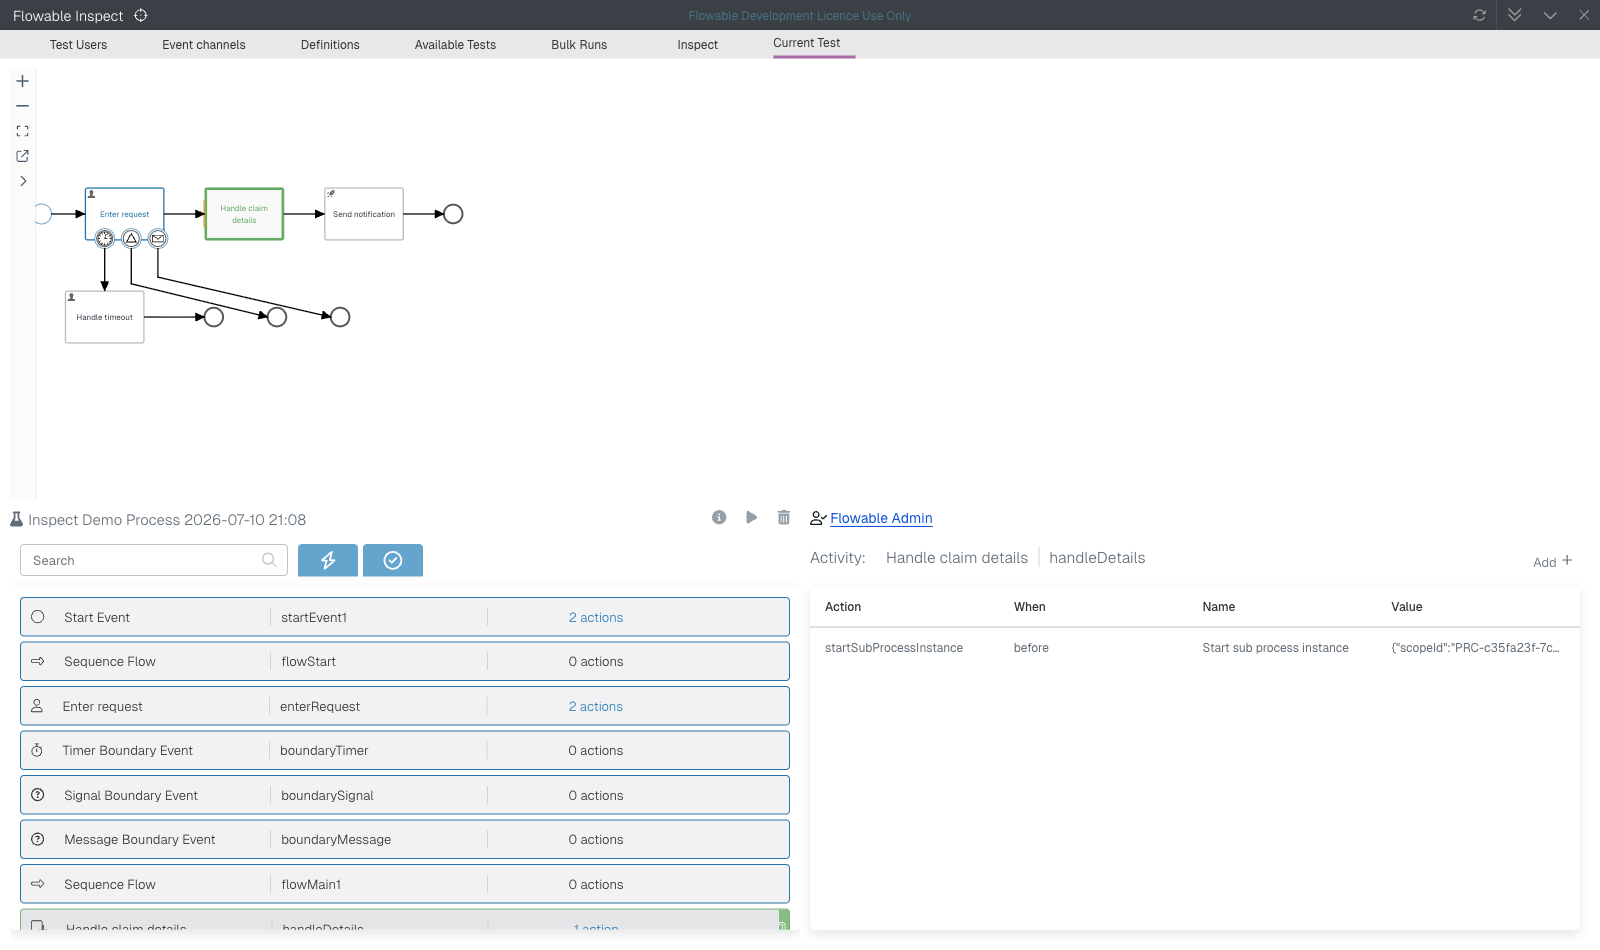
The steps on the left side show the activities that have been completed and terminated, and also shows an active call activity with a breakpoint. We could now add a test value action to test a variable value at this point in the process execution, if we wished. Or do a more complex validation with an expression. In the diagram, it's also visually indicated that the current process state is the before breakpoint on the call activity element.
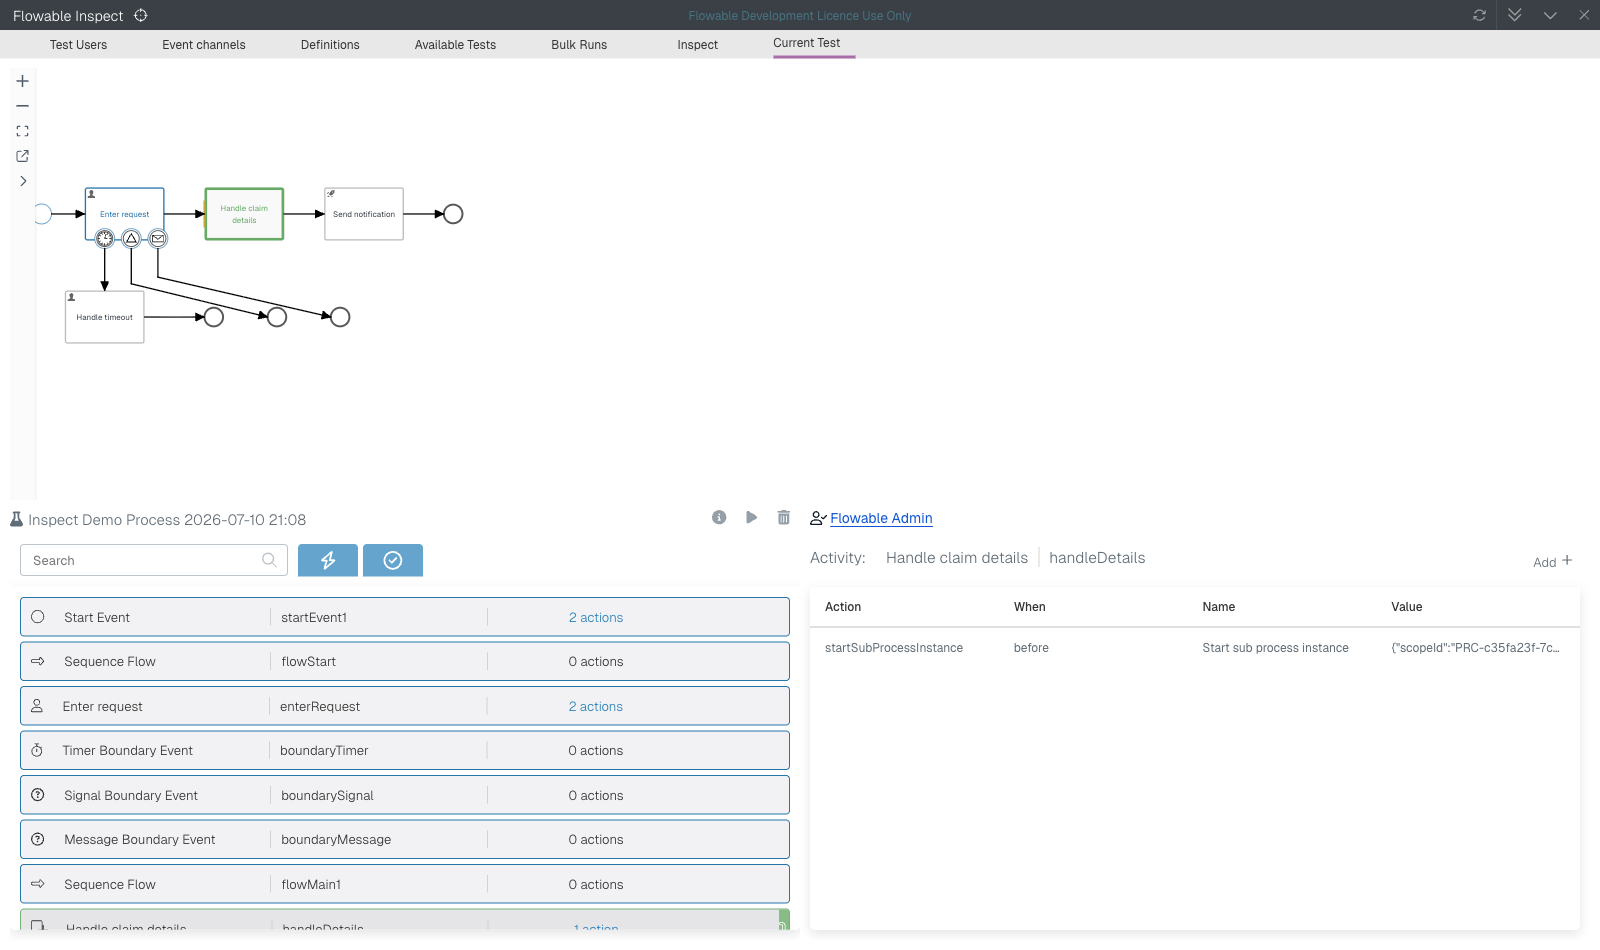
The dark yellow line that we saw in the previous diagram is now red, which means that this breakpoint has been reached. When we click on the second button in the step overview to continue the next transaction, the breakpoint is executed and removed. The sub process instance is now created and when navigating to the user task in the sub process instance, the step overview is filtered.
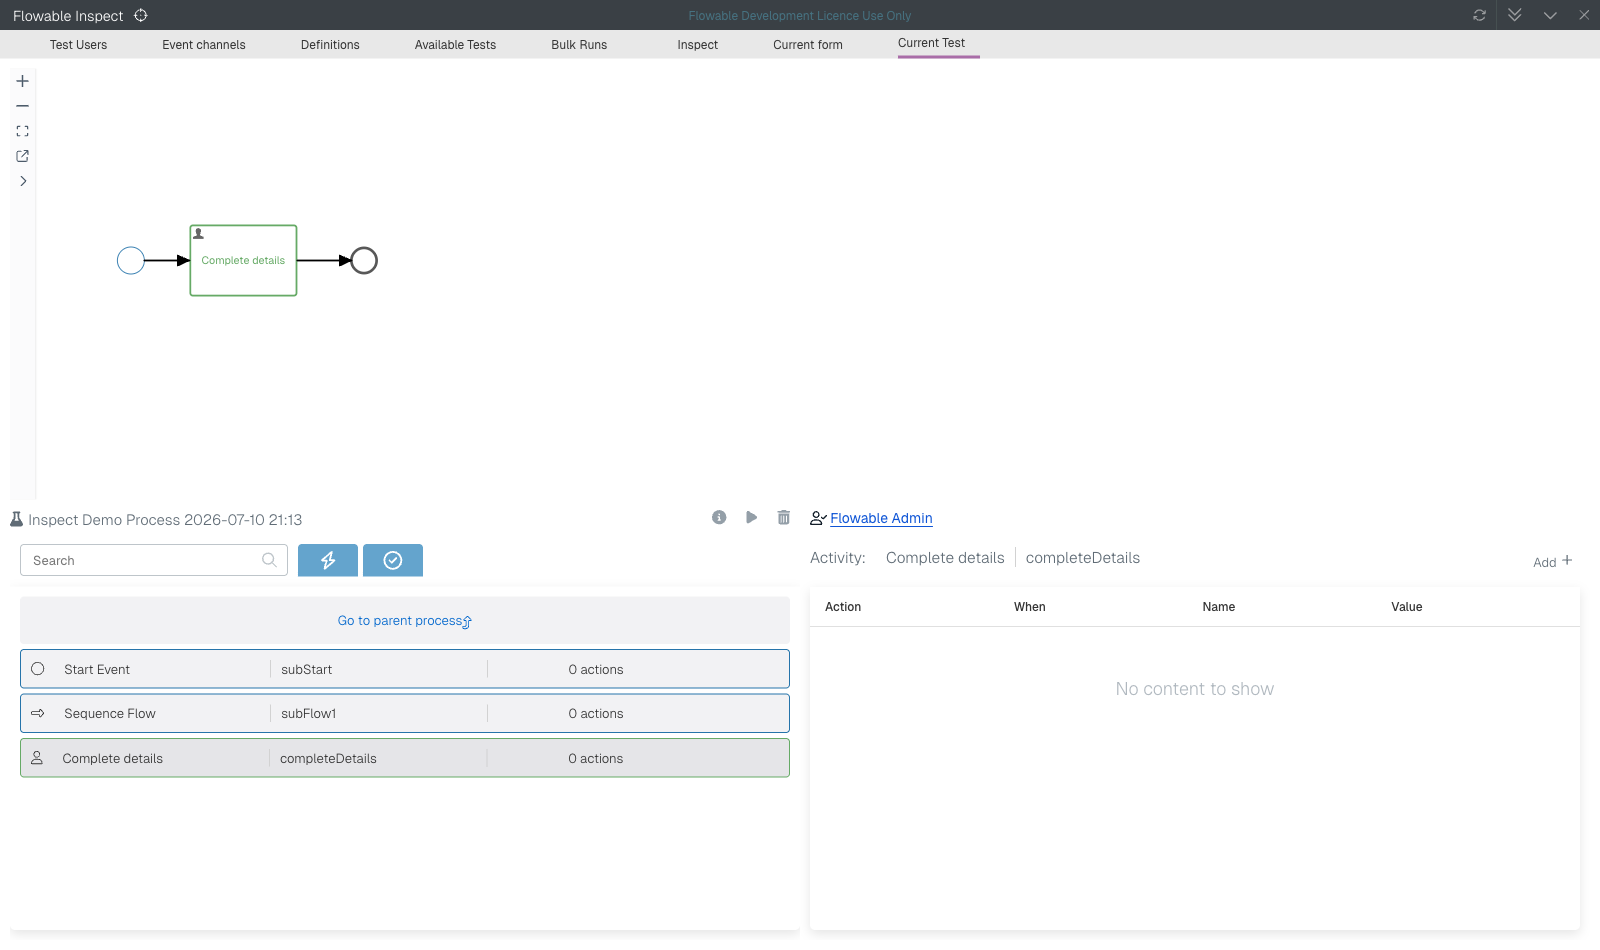
In the step list, only the steps of the sub process instance are shown to make it easier to see the current state in that instance. With the Go to parent process button it's easy to navigate back to the root process instance. Also the Flowable Work UI navigation will go to the root process instance view when clicking the navigation button. Continuing the sub process instance until it's completed, the call activity will complete as well and the Send notification service task will be reached. Because we added an after breakpoint there, the process will wait again right after the service task has run, and we can add test actions, such as testing values or testing an expression, to validate the outcome of the service task execution. An example of such an after breakpoint on a service task is shown in the next section.
Working with skip definitions
In addition to breakpoints, Flowable Inspect also allows users to skip over service or HTTP tasks. The main use case is to avoid the need to have all the external services available that are invoked from a CMMN or BPMN model. With skipping an HTTP task, for example, the REST service doesn't have to be available to be able to test the CMMN or BPMN model. Combined with adding an after breakpoint, we can set values on the case or process instance to mock the output values of the HTTP task and test multiple possible responses.
Skip definitions can be added in a similar way as breakpoints via the diagram view. When we expand the diagram again to have it available in the top half of the screen we can add a skip definition, like in the following service task example.
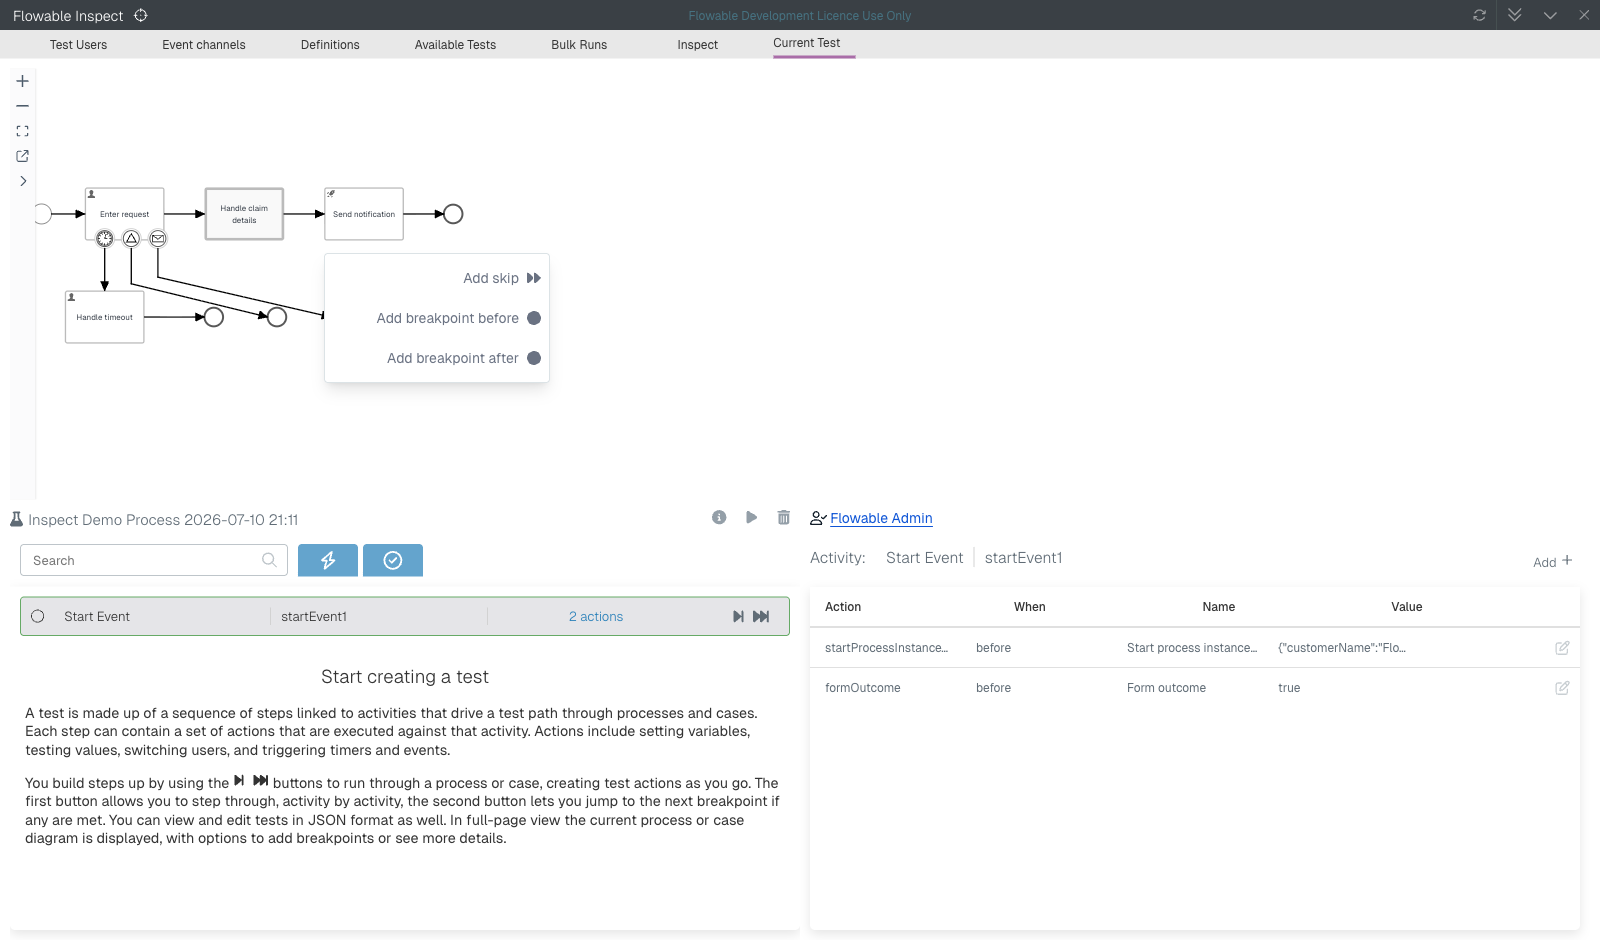
When the skip definition is added, we can also add an after breakpoint to be able to set the variable values that otherwise would have been set by the service task. The diagram then shows visual indicators for both the skip definition as well as the breakpoint.
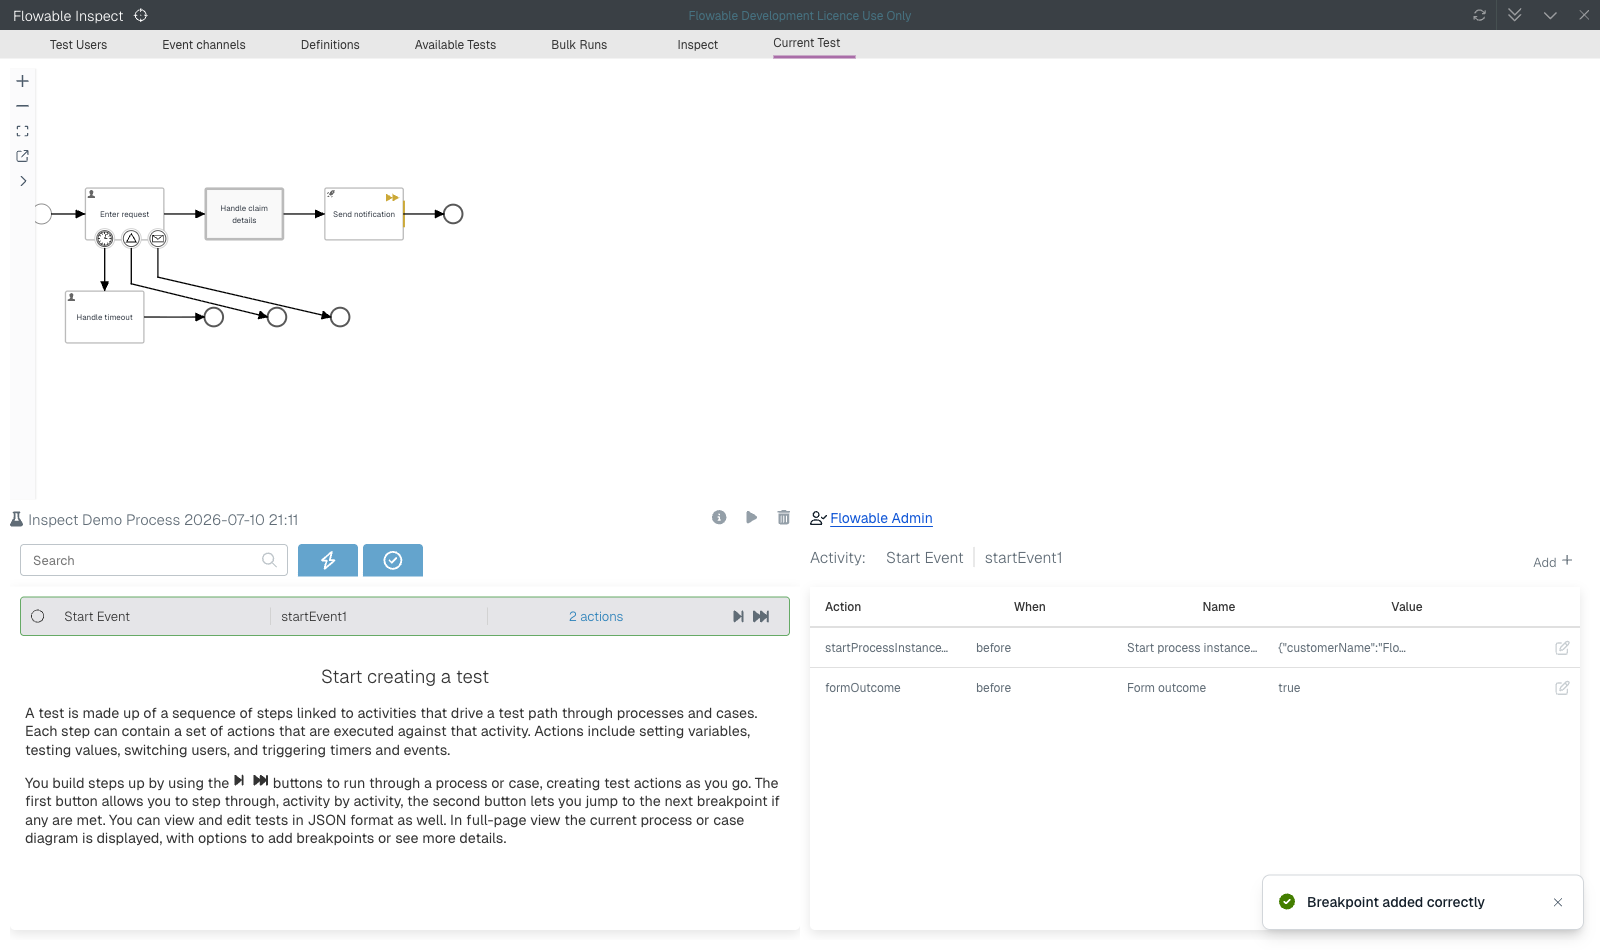
The skip definition is shown with two triangles, and in the example we can also see an after breakpoint. When we continue the process execution from the initial breakpoint at the start event, we can now see that the service task logic is completely skipped and the after breakpoint of the service task has been reached.
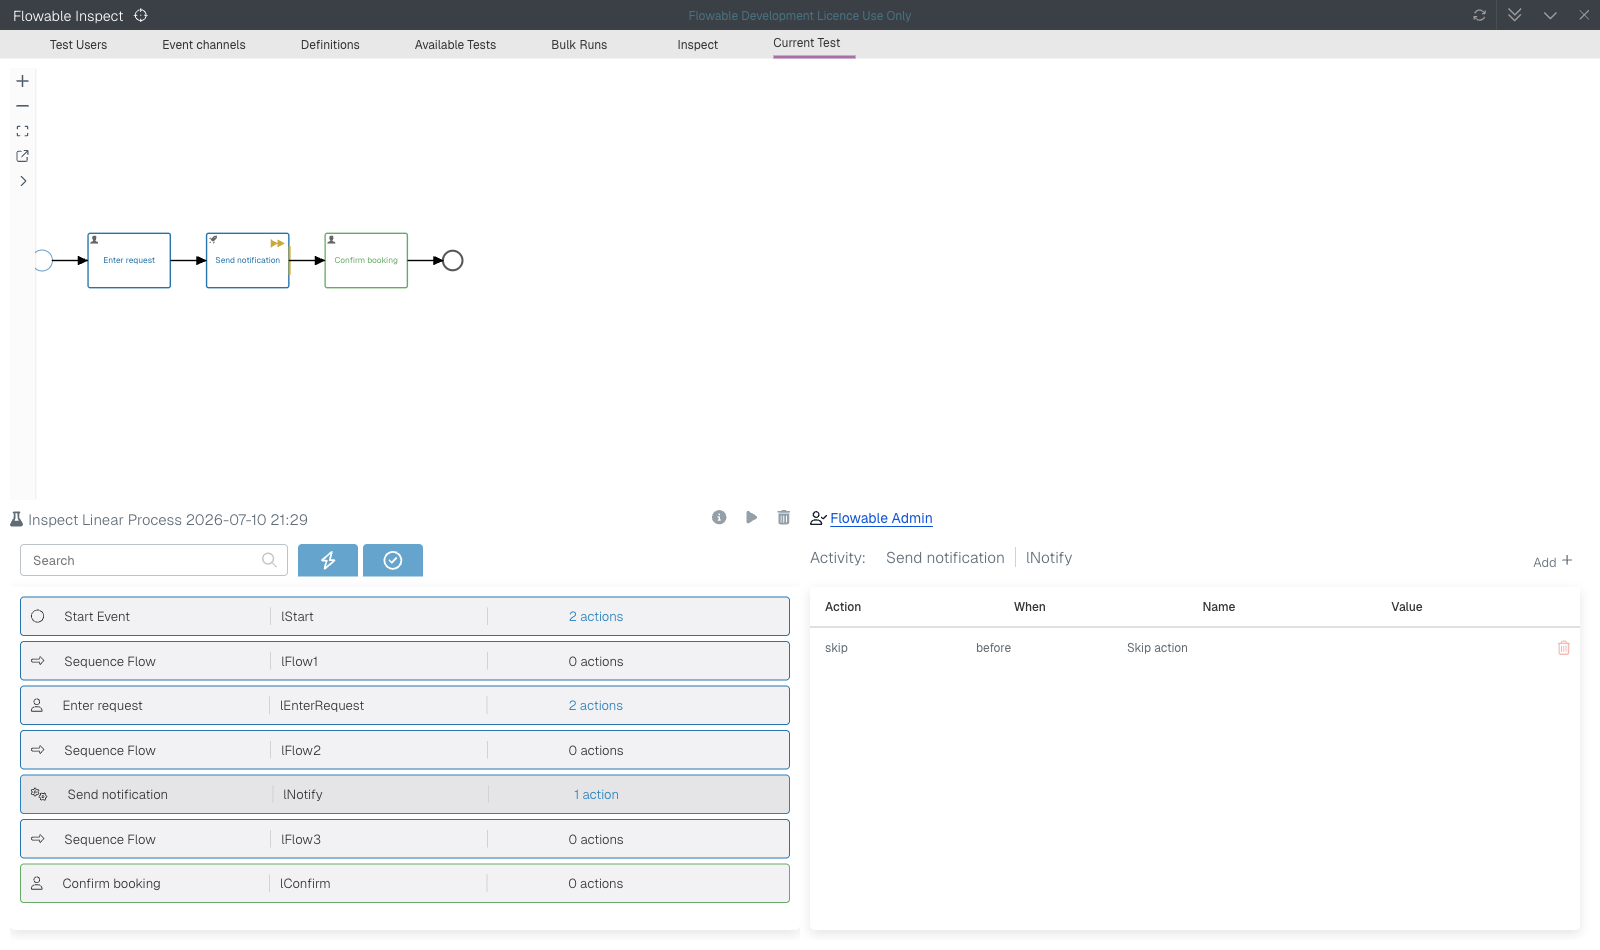
With the after breakpoint now active, we can again add test actions on this service task. For example, we can add a set value action to mock the output of the service task.
Run a test model
Now that we've created test models, worked with breakpoints and skip definitions, the next step is to run a test model. A test model can be re-run whenever you want. In this way we can run test models on new versions of CMMN and BPMN models when applicable. One way to run a test model is from the Available Tests tab where all recorded test models are shown. There's an option to quickly filter the test models by the current select case or process model with Show tests related to current instance.
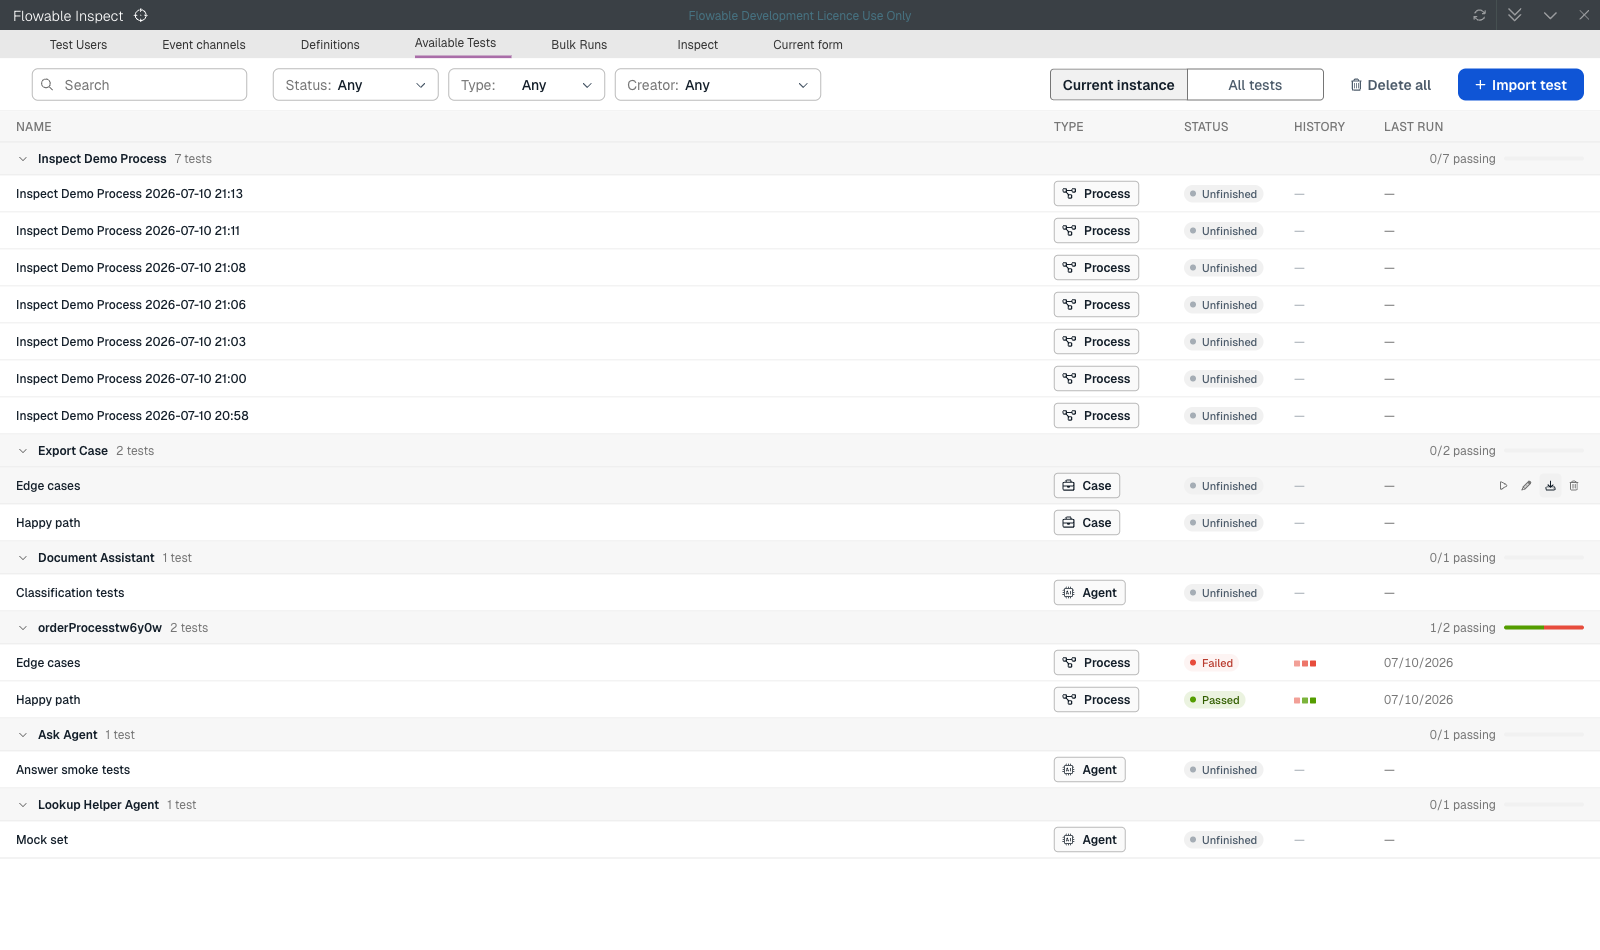
The list of available tests shows the instance and definition name together with information about who and when it was created. If the instance was fully completed, a completed time is also shown. It's not necessary to complete a test model instance, because we can also use it to record the case or process flow just up to a certain point in the model. The two icons shown on the right side of a test model item are for play and download. The play button will run a new test instance of the model, while the download button will export a test model JSON file.
On clicking on the play button, a confirmation dialog is shown to check if we want to run a new test instance. After clicking OK, a new test run is performed. The test run tab shows the same step overview as when building a new test model on the left side. On the right side, the test logging information is displayed, including informational messages and any error messages.
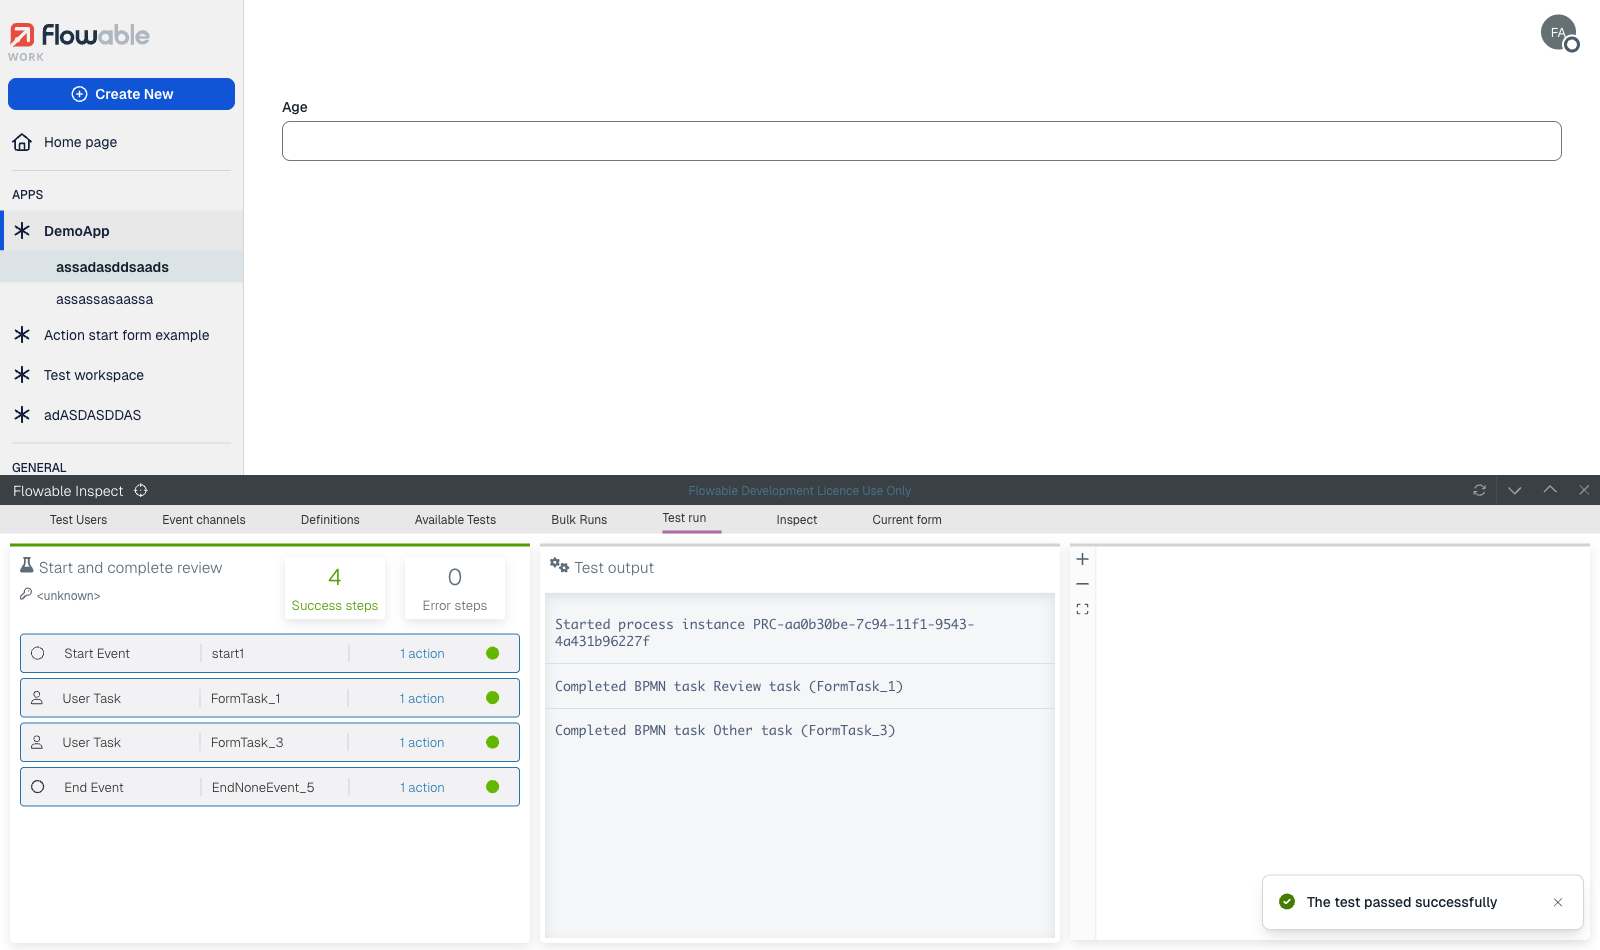
In the example above, the test has run successfully and no test errors were found. Now let's look at an example where a variable value is not as expected.
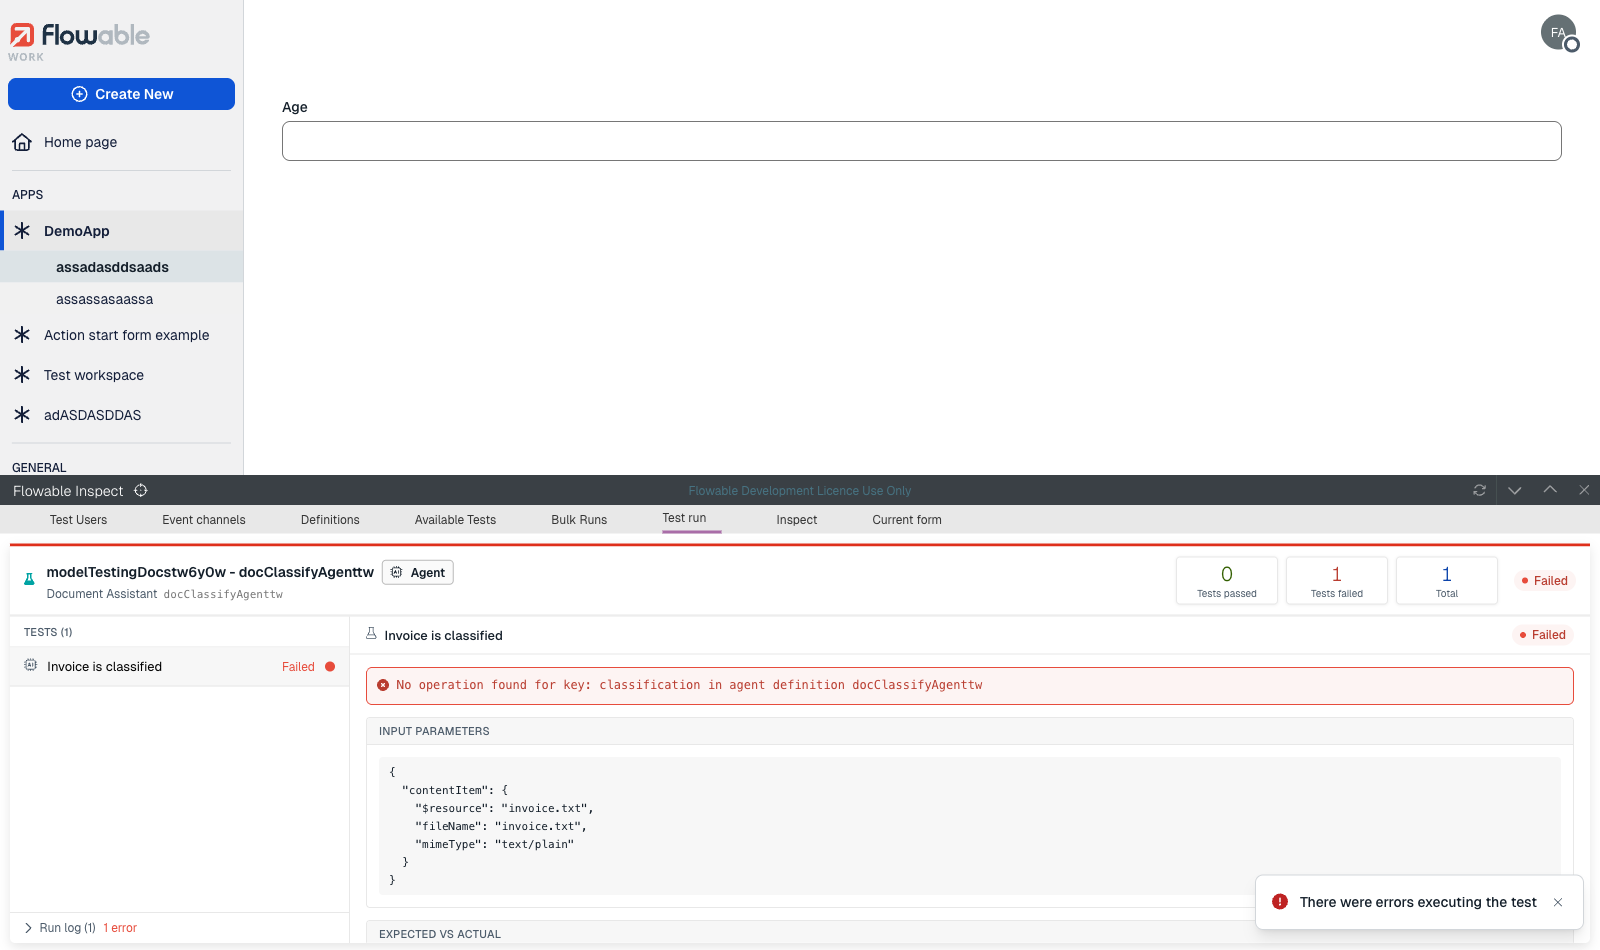
The error is clearly highlighted in the test logging information, including the expected and actual value of the amount variable.
Running tests in bulk
2026.1.0+Instead of running recorded test models one by one, you can run a whole selection of them together from the Bulk Runs tab. Select the test models you want to include and start the run; Flowable Inspect executes them and shows the aggregated result, so you can quickly see which tests passed and which failed after a change to your models.
Publishing tests from Flowable Design
2026.1.0+Test models are not only recorded in Flowable Inspect. Tests that are authored in Flowable Design (see Model Testing) can be published to Flowable Inspect on a connected Flowable Work runtime and then run there, either individually from the Available Tests tab or together from the Bulk Runs tab. This lets modelers design tests up front in Flowable Design and have them executed against the runtime through Flowable Inspect.
Exporting and importing a test model
To facilitate the sharing test model between different modeler and test users, a test model can be exported by clicking the download icon in the Available Tests tab. This will download a JSON document containing all the information about the test model.
In the same tab there is a Import test button above the list view. Clicking this will allow a test model JSON file to be selected from the file system and be imported into the available tests list. It's important that the CMMN and BPMN models that are used in the test model are deployed in the environment before importing the test model JSON file. This is because when the test model is imported, a lookup is performed to find all the CMMN and BPMN models used in the test model.
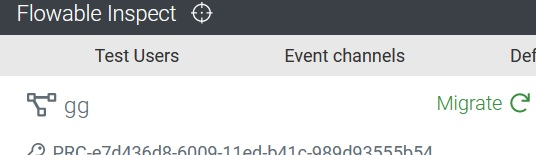
The Migration button not visible in Flowable Inspect
It is worth noting that the migrate button only appears when you have 2 or more versions deployed and will look like the image below:
Using the impersonate feature
While not technically part of Inspect, this feature allows you to switch and impersonate another user and is useful for testing.
You need to add the following line to your application.properties file:
flowable.security.impersonate.allowed=true
And also ensure you have enabled the "impersonateUser" feature in the user definition.
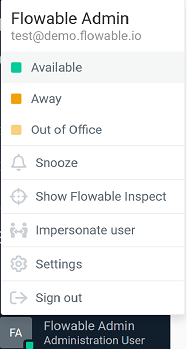
From that point you should be able to see the option in the user menu in the top-right corner of Flowable Work. When you click it a pop up will appear allowing you to view information as a different user.
Mocking service calls
2026.1.0+REST-based service operations can return a configured mock response instead of calling the real endpoint. This is helpful when the real service is not available in a development environment, or when you want to test how a model behaves for a particular response or error without depending on the live system. The mock responses themselves are defined in the service registry model in Flowable Design (see Mocking Service Responses). From Flowable Inspect you control whether those mock responses are used at runtime.
Enabling mocking from Inspect
To reach the mock settings, open an existing case or process instance in the Flowable Work UI with the Inspect view open, and select Service Registry from the dropdown above the middle panel.
In the Inspect view you can turn mocking on or off without changing any configuration property or redeploying. The Mock Settings dialog offers two levels:
- Global Default applies to every REST service. When left as Not set, the configured property is used.
- Per-Service Overrides turn mocking on or off for a single service, overriding the global default. Use Add service override to add a service, then toggle it on or off.
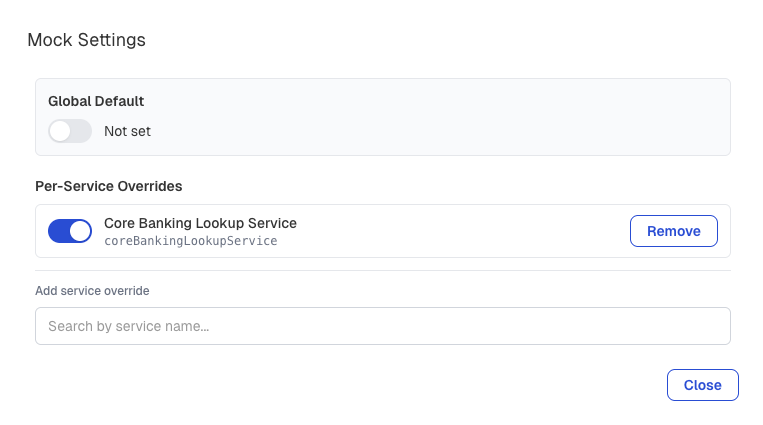
A setting made in Inspect takes precedence over the mockEnabled property configured for the environment.
This means you can keep mocking switched off by default and enable it from Inspect only while you are
investigating or testing a model.
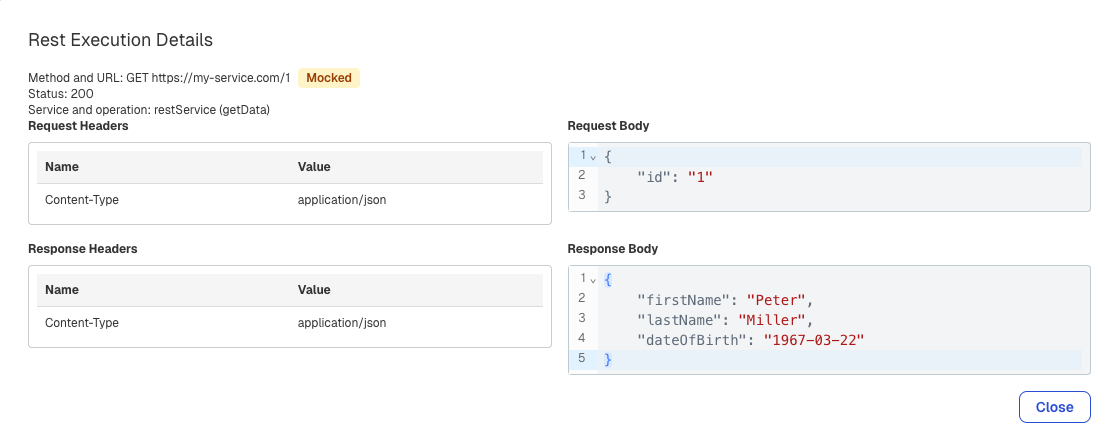
Recognizing a mocked call
When a service call is served by a mock instead of reaching the real service, Flowable Inspect marks that call with a Mocked badge in its execution details. This lets you tell, at a glance, which calls in an instance were answered by a mock and which actually reached the live service.