Dashboards
The Dashboards option allows a user to create dashboards using a catalog of dashboard components. Flowable Work ships with a set of out-of-the-box components, but custom ones can easily be created using customized query models and dashboard component models.
 note
noteIf dashboards aren't visible, they might need to be enabled by an administrator user. See the admin guide for more details.
Also note that dashboards are user-bound, i.e. the dashboards are unique to the logged in user.
The dashboard UI has two high-level UI parts: the Header with filters and the Component Canvas:
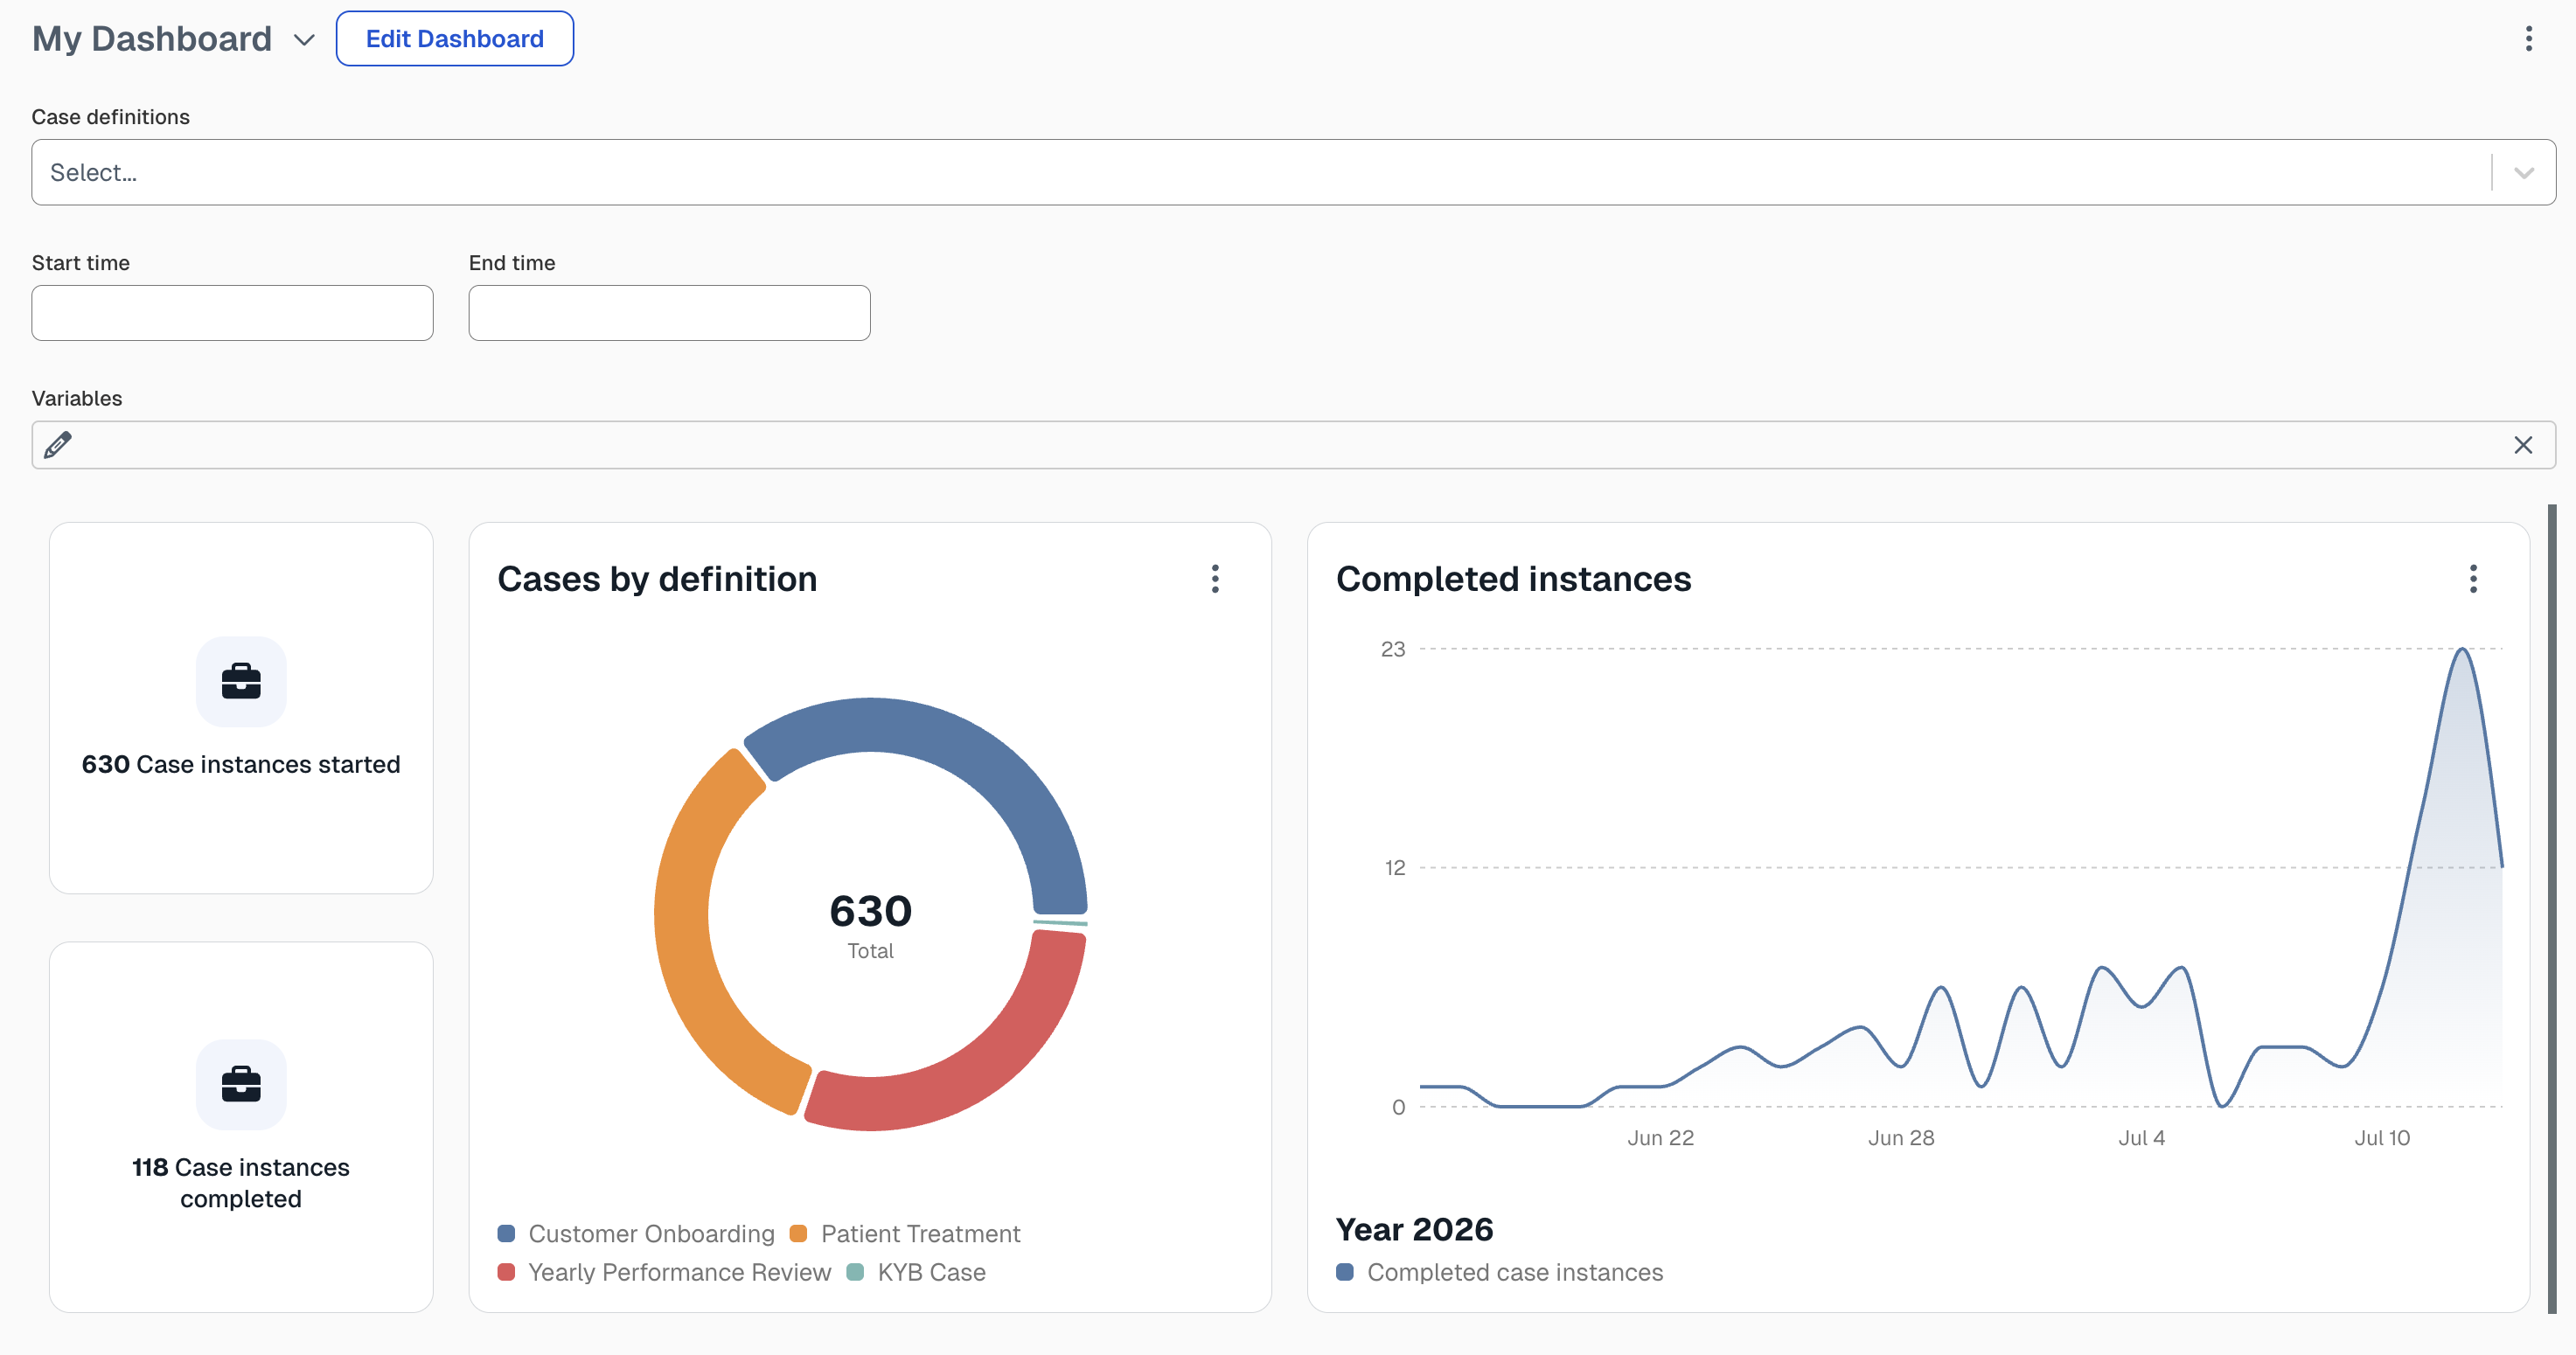
After creating a new dashboard, click the Edit dashboard button, which puts the canvas into edit-mode:
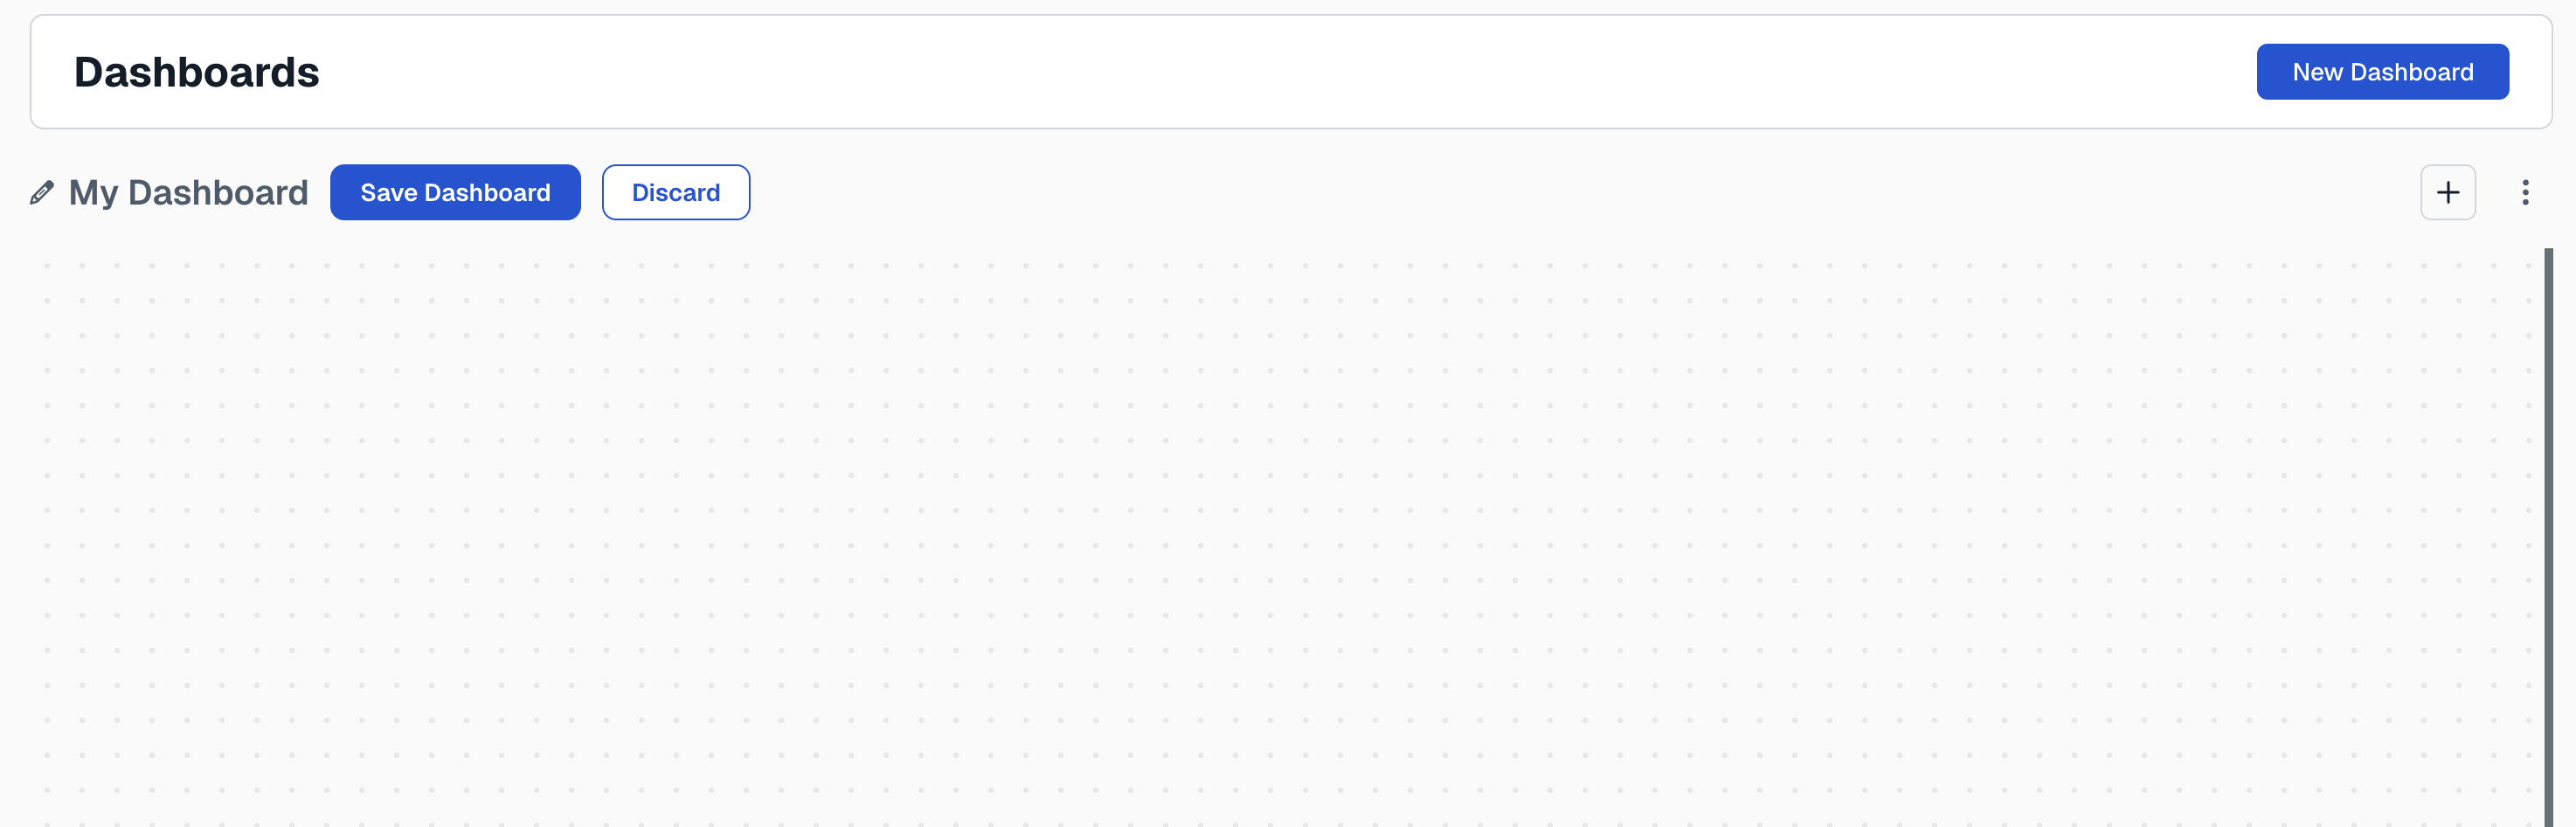
The button with the plus icon on the right-hand side can be used to add new components. The three dots can be clicked to show the filters or to delete the dashboard. The Save dashboard button on the left will save all current changes and switch back to the view-mode.
Clicking the button with the plus icon button opens the Component catalog, which lists every component available to you: the out-of-the-box components shipped with Flowable Work plus any custom components published to this system.
Components in the catalog are organised by category: Agent, Case, Process and Task. Select a category to browse its components, then pick one to add it to the dashboard. If any component is uncategorized, it will show up in Custom (and in the All category)
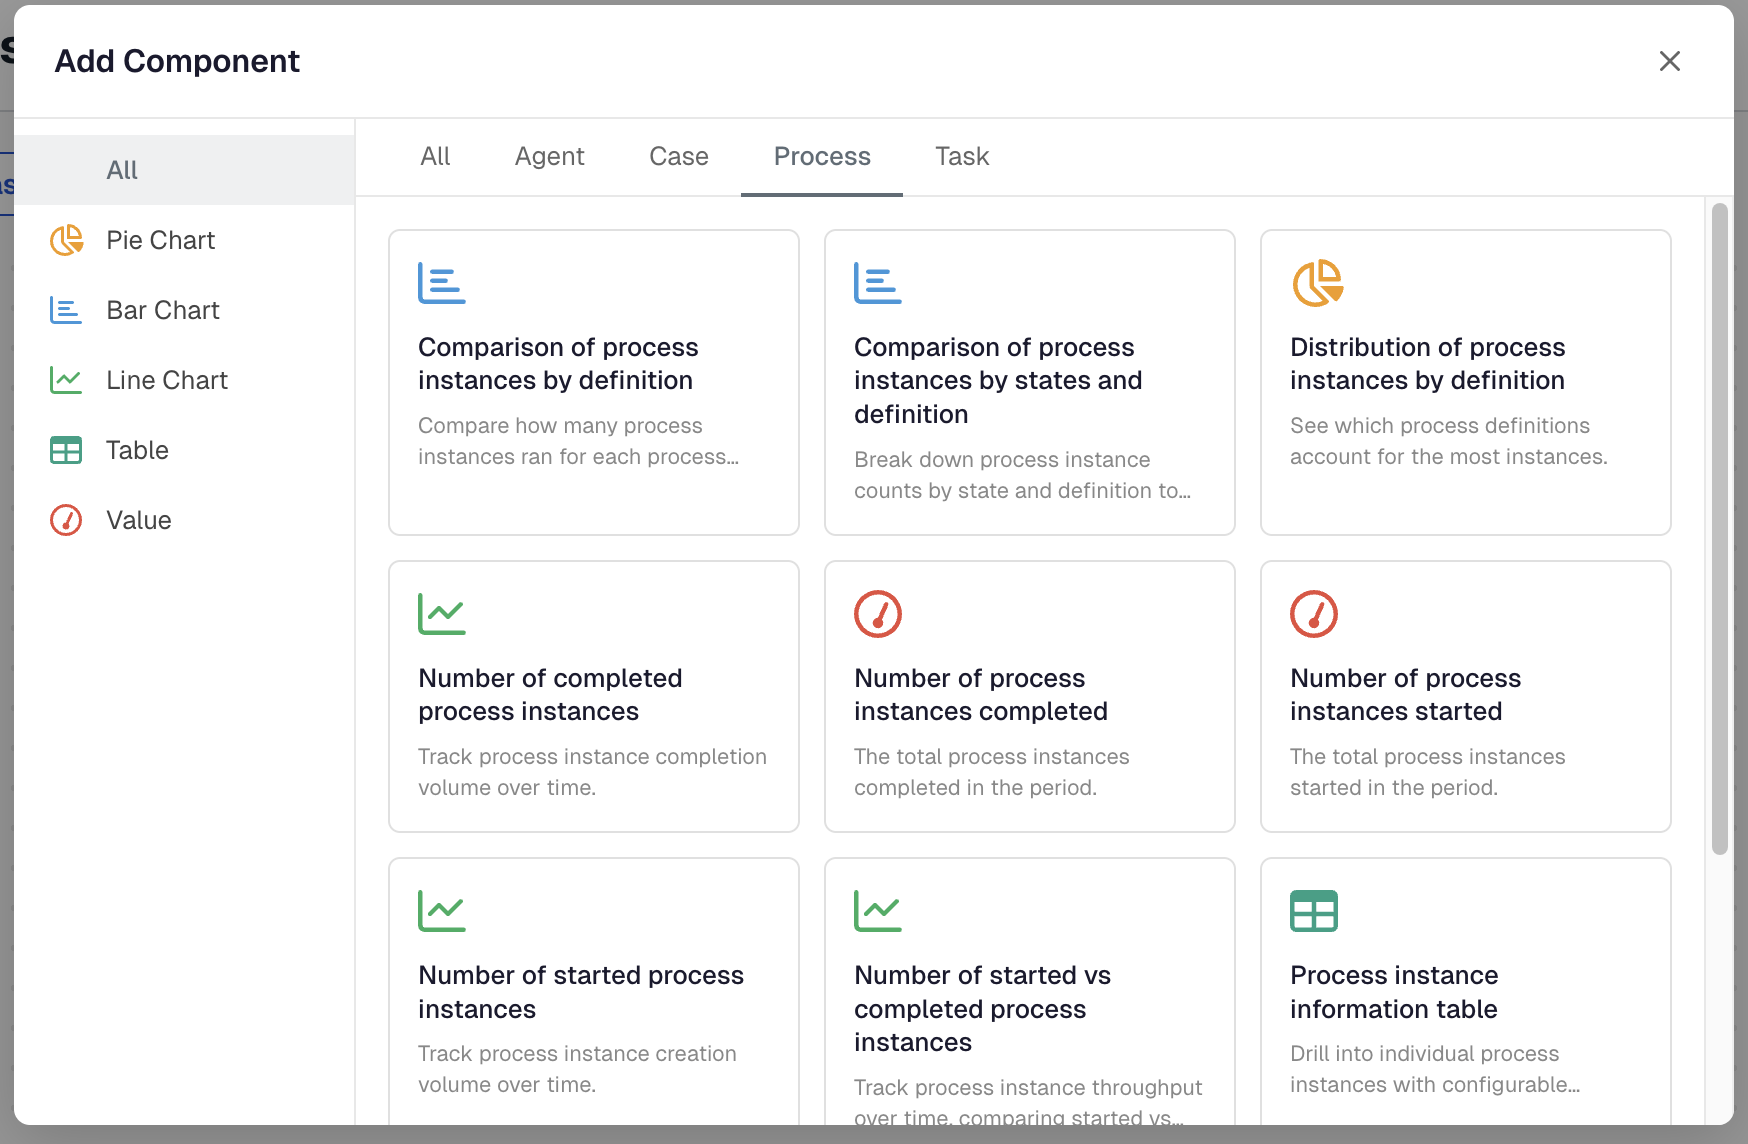
The categories are described in more detail in Out-of-the-box components below. Note that the Agent components are only visible to users with the access-agentData authority.
After choosing a component, a custom title and component-specific settings can be configured.
noteWhen multiple dashboard components reuse the same filter (for example the process definition picker), only one entry is rendered in the header. When the filter is changed, all components that use it will re-fetch the data and re-render.
Out-of-the-box components
The following out-of-the-box components ship with Flowable Work, grouped by the catalog categories. Most can be filtered by a time period (start/end) and by the relevant definition; when several components on the same dashboard share a filter, it is rendered only once in the header. The catalog contains additional variants (per-definition, per-model, per-date breakdowns) of many of them.
Agent
Components for monitoring AI agents. They require the access-agentData authority (a user without it will not see the Agent category) and read from indexed agent data, so agent data indexing must be enabled for them to show meaningful values. They can be filtered by agent definition and time period.
Agent components measure two runtime concepts: agent instances (individual runs of an agent definition) and agent invocations (the individual agent/LLM calls made within those runs).
Instances & invocations: how much agent activity is happening, and the state of agent runs.
| Component | Shows | Type |
|---|---|---|
| Agent invocations | Total number of agent/LLM calls in the period | Value |
| Instances started / completed | Agent runs started and completed | Value |
| Instance state | Distribution of instances by state | Pie Chart |
| Invocations over time | Invocation volume per day | Line Chart |
Token usage: consumption of prompt, output and cached tokens.
| Component | Shows | Type |
|---|---|---|
| Total tokens | Sum of all tokens used | Value |
| Average tokens per invocation | Mean token usage per call | Value |
| Token type share | Prompt vs. output vs. cached split | Pie Chart |
| Total tokens over time | Token consumption per day | Line Chart |
Cost: estimated LLM cost, based on the configured per-model prices.
| Component | Shows | Type |
|---|---|---|
| Total agent cost | Estimated cost across all LLMs | Value |
| Cost by LLM | Cost broken down per model | Bar Chart |
| Cost over time | Estimated cost per day | Line Chart |
Tools & latency: tool calls made by agents and how long they take.
| Component | Shows | Type |
|---|---|---|
| Total tool calls | Number of tool invocations | Value |
| Tools by name | Most/least used tools | Bar / Pie Chart |
| Tool latency percentiles | p50 / p95 / p99 tool duration | Bar Chart |
| Average tool duration | Mean tool execution time | Value |
Guardrails: guardrail evaluations and violations.
| Component | Shows | Type |
|---|---|---|
| Guardrail violations | Number of guardrail violations | Value |
| Guardrail pass rate | Share of evaluations that passed | Pie Chart |
| Total guardrail evaluations | Number of guardrail checks | Value |
| Guardrails over time | Violations/evaluations per day | Line Chart |
Case
Components for monitoring case instances, filterable by case definition and time period.
| Component | Shows | Type |
|---|---|---|
| Number of case instances started | Total case instances started in the period | Value |
| Number of case instances completed | Total case instances completed in the period | Value |
| Distribution of case instances by definition | Which case definitions account for the most instances | Pie Chart |
| Case instance status breakdown | The active-vs-completed split at a glance | Pie Chart |
| Comparison of case instances by definition | Compare how many case instances ran for each definition | Bar Chart |
| Comparison of case instances by states and definition | Break down counts by state and definition to spot stuck cases | Bar Chart |
| Number of started case instances | Case instance creation volume over time | Line Chart |
| Number of completed case instances | Case instance completion volume over time | Line Chart |
| Number of started vs completed case instances | Throughput over time, comparing started vs completed | Line Chart |
| Case instance information table | Drill into individual case instances with configurable, sortable columns | Table |
Process
Components for monitoring process instances, filterable by process definition and time period.
| Component | Shows | Type |
|---|---|---|
| Number of process instances started | Total process instances started in the period | Value |
| Number of process instances completed | Total process instances completed in the period | Value |
| Distribution of process instances by definition | Which process definitions account for the most instances | Pie Chart |
| Process instance status breakdown | The active-vs-completed split at a glance | Pie Chart |
| Comparison of process instances by definition | Compare how many process instances ran for each definition | Bar Chart |
| Comparison of process instances by states and definition | Break down counts by state and definition to spot stuck processes | Bar Chart |
| Number of started process instances | Process instance creation volume over time | Line Chart |
| Number of completed process instances | Process instance completion volume over time | Line Chart |
| Number of started vs completed process instances | Throughput over time, comparing started vs completed | Line Chart |
| Process instance information table | Drill into individual process instances with configurable, sortable columns | Table |
Task
Components for monitoring tasks, filterable by process/case definition and time period.
| Component | Shows | Type |
|---|---|---|
| Number of tasks created | Total tasks created in the period | Value |
| Number of tasks completed | Total tasks completed in the period | Value |
| Distribution of tasks by process or case definition | Which definitions generate the most tasks | Pie Chart |
| Task status breakdown | The active-vs-completed split at a glance | Pie Chart |
| Number of created tasks | Task creation volume over time | Line Chart |
| Number of completed tasks | Task completion volume over time | Line Chart |
| Number of created vs completed tasks | Throughput over time, comparing created vs completed | Line Chart |
| Task information table | Drill into individual tasks with configurable, sortable columns | Table |